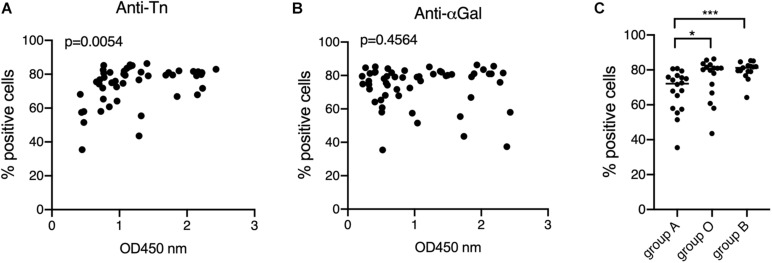
FIGURE 5.
Relationships between the anti-Tn and anti-αGal levels, ABO phenotypes and the levels of anti-S protein. Anti-S protein antibodies of COVID-19 patients were detected and quantified by the S-Flow assay at a plasma dilution of 1: 300. Data are shown as percentage of positive cells. Only positive plasma samples were considered. (A) Correlation between anti-S and anti-Tn, Spearman r p value is shown; (B) correlation between anti-S and anti-αGal, Spearman r P-value is shown; (C) relationship between ABO phenotypes and anti-S. Only anti-S positive individuals (with cut-off values >30%) were considered. P-values from Mann-Whitney comparisons are indicated: *p < 0.05, ***p < 0.001.

