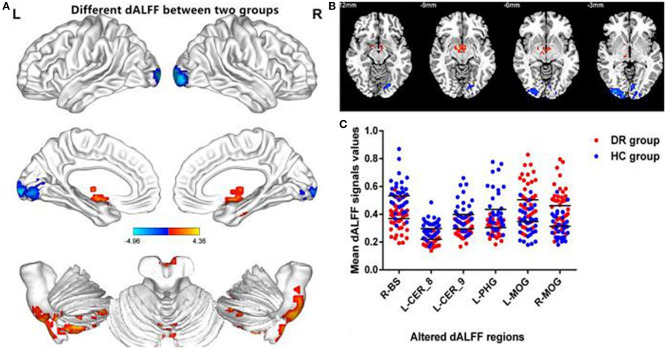
Figure 3.
Comparison of different dALFF values between the DR group and HC group. Significant dALFF value differences were observed in the R-BS, L-CER_8, L-CER_9, L-PHG, L-MOG, R-MOG (A,B). The mean values of altered dALFF values between the DR and HC groups (C). dALFF, dynamic amplitude of low-frequency fluctuation; DR, Diabetic Retinopathy; HC, Health Controls; GRF, Gaussian random field; BS, Brainstem; CER, Cerebellum; PHG, Parahippocampal; MOG, middle occipital gyrus; L, left; R, right.

