Figure 7.
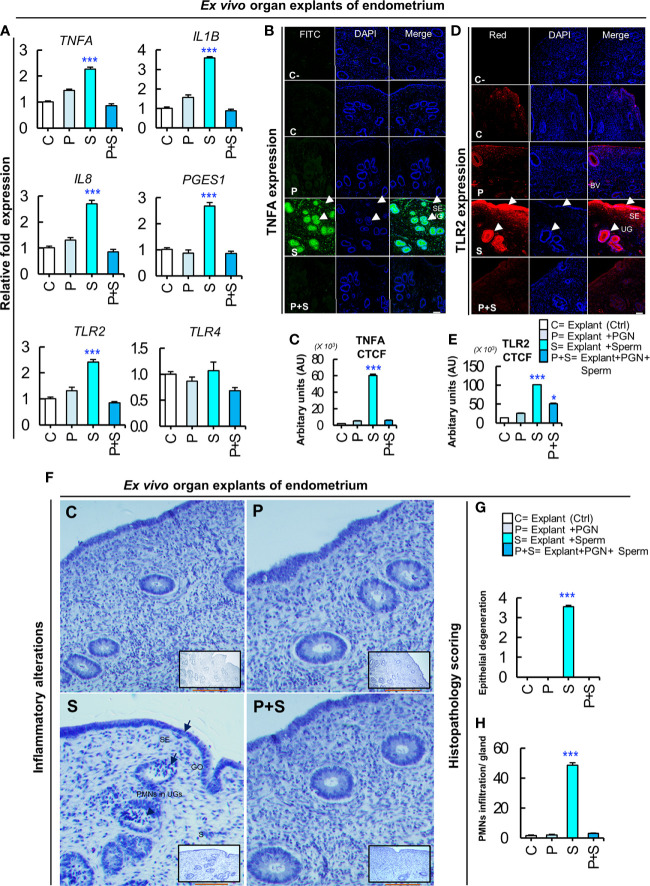
PGN suppresses the sperm-triggered alterations in inflammatory genes and protein expression as well as histomorphology in ex vivo explants of endometrium. (A) Real-time PCR assay of the mRNA transcription levels of sperm-stimulated inflammatory genes after exposure to PGN. Fresh pre-ovulatory explants were exposed to PGN (10 pg ml−1) for 3 h followed by co-culturing with sperm for 3 h. The mRNA expression of different inflammatory genes was assessed. Asterisk denote a significant variance (***P < 0.001) between the different groups when compared to the control group and data are presented as mean ± SEM. (B) Immunofluorescence assay of candidate inflammatory marker (TNFA) in ex vivo organ explants of endometrium. Immunostaining confirmed intense accumulation of TNFA (green) in UGs and surface epithelium (SE) (arrow heads) compared to stroma (S) in the “S” group and this was abrogated in the “P+S” group. (C) Semiquantitative scoring of corrected total cell fluorescence (CTCF) of TNFA was based on mean fluorescence intensity (MFI) and integrated density (IntDen) by ImageJ software expressed as arbitrary fluorescence units (AU). DAPI was set as the nuclear counterstain (blue). Normal rabbit IgG replaced the primary antibody in the negative control (C-). (D) Immunofluorescence assay of the signaling marker (TLR2) in ex vivo organ explants of endometrium. Immunostaining confirmed intense accumulation of TLR2 (red) induced by sperm (“S” group) specifically in UGs and SE (arrow heads), compared to stroma (S) and compared to the C and other treated groups (P, and P+S). (E) Semiquantitative scoring of corrected total cell fluorescence (CTCF) of TLR2 expressed as arbitrary fluorescence units (AU). Fluorescence signal was captured using an all-in-one epifluorescence high-resolution imaging system (Keyence, BZ-X800, Osaka, Japan). BZ-X GFP (OP-87763), BZ-X RED (OP-87765), and BZ-X DAPI (OP-87762) filters were set for green, red and blue wavelengths, respectively. Random images from 3 independent experiments (using 3 different healthy pre-ovulatory uteri from 3 different animals) were evaluated and readings were statistically analyzed where asterisks denote a significant variance (*P < 0.05, and ***P < 0.001) between the different groups when compared to the control group and data are presented as mean ± SEM. Magnification: 200×. Scale bar = 50 μm. (F) Representative photomicrographs showing delicate inflammatory reaction triggered by sperm in “S” group represented by reversible endometrial tissue injury particularly in uterine glands (UGs), surface epithelium (SE) or gland opening (GO) (short arrows), but not in stroma (S). Hematoxylin and Eosin (H&E) semiquantitative scoring of (G) epithelial degeneration, and (H) mild neutrophilic infiltration (PMNs) (arrow heads) in UGs was used to quantify degree of histopathological alterations compared to other groups (C, P and P+S) where asterisks denote a significant variance (***P < 0.001) ± SEM. Magnification: 400×. Scale bar = 200 μm.

