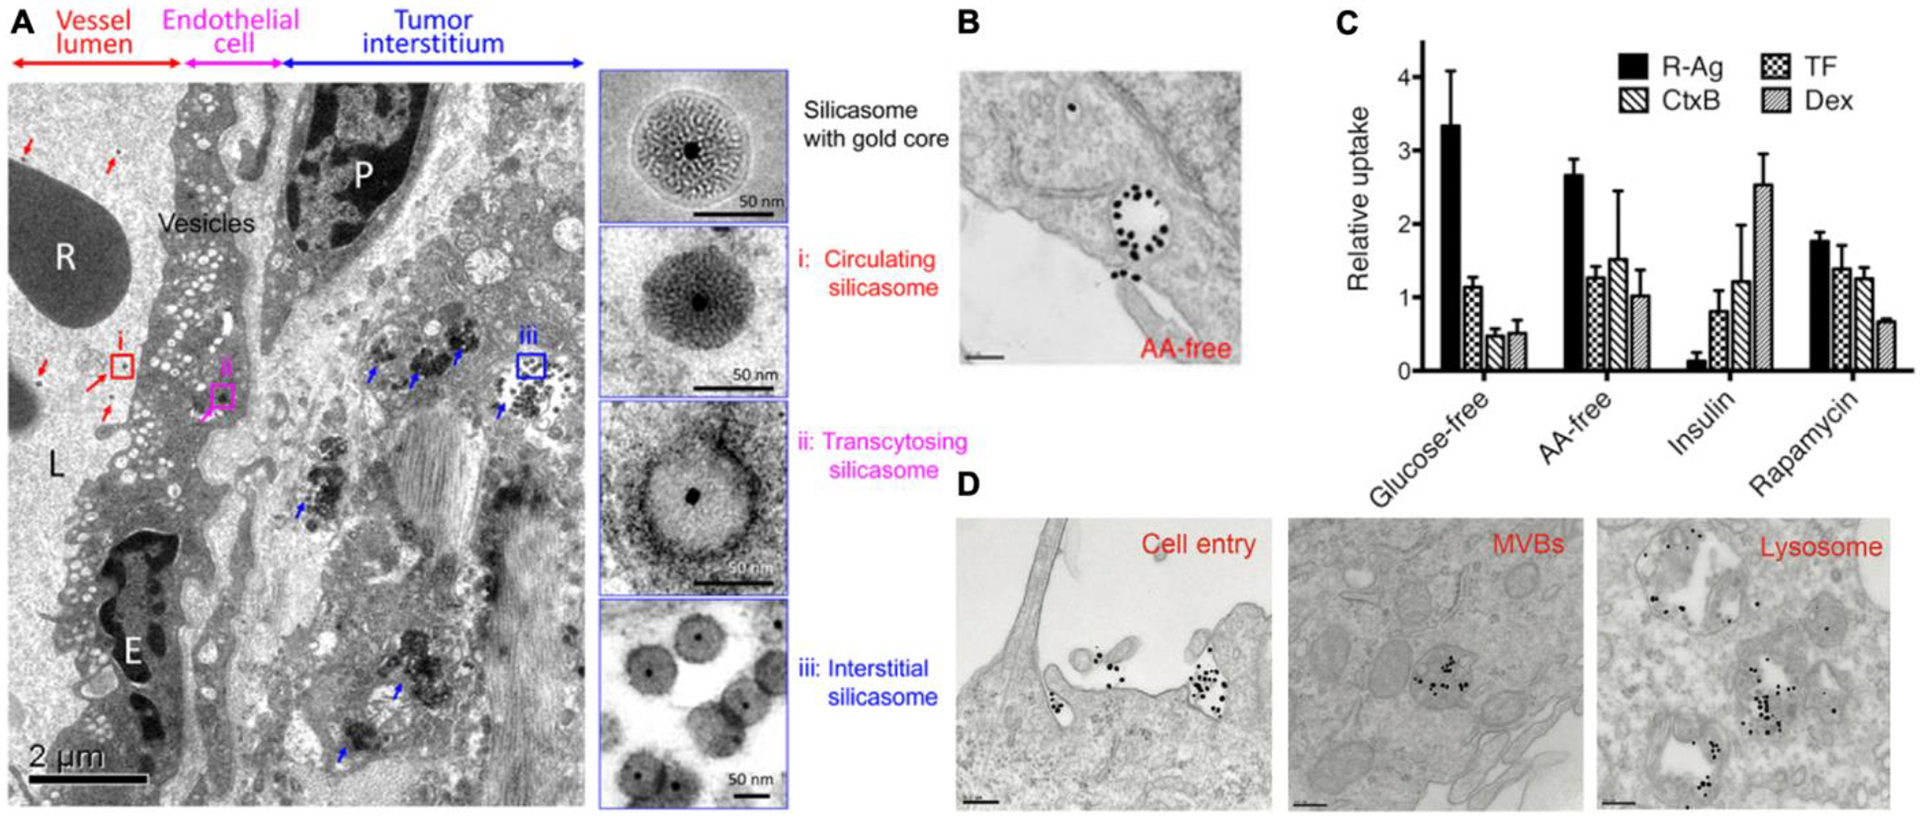
Figure 2. Receptor-mediated macropinocytosis and the uptake of CPP-functionalized nanoparticles.

(A) TEM images shows that CendR peptide induced a transcytosis for NP vascular penetration. Silicasome NPs co-administered with iRGD appeared in (i) the blood vessel lumen (red arrows), (ii) transport vesicles in endothelial cells (pink arrows) and (iii) the tumor matrix (blue arrows). Right panels were magnified regions (i) through (iii). R, red blood cell; E, endothelial cell; P, pericyte. Scale bar = 2 μm (left panel) or 50 nm (right panel). The image is adapted from [65].
(B) RPARPAR coated gold NPs (dense dark dots) were observed to be internalized into macropinocytosis-like vacuoles, which were evident in the medium depleted of amino acids. Scale bar = 200 nm. The TEM image is adapted from [66].
(C) The cellular uptake of endocytic tracers (indicated on the upper left corner of the figure) responds differently to environmental cues. The y-axis shows the cellular uptake of each tracer relative to that in the complete cell culture medium (glucose- or AA-free) or treated by control solvents (insulin or rapamycin). The image is adapted from [66].
(D) Gold NPs coated with TAT (dense dark dots) were observed to be engulfed by macropinocytosis-like vesicles, and sequentially transported through the indicated compartments (from left to right). Scale bar = 200 nm. The image is adapted from [70].
