
FIGURE 8.
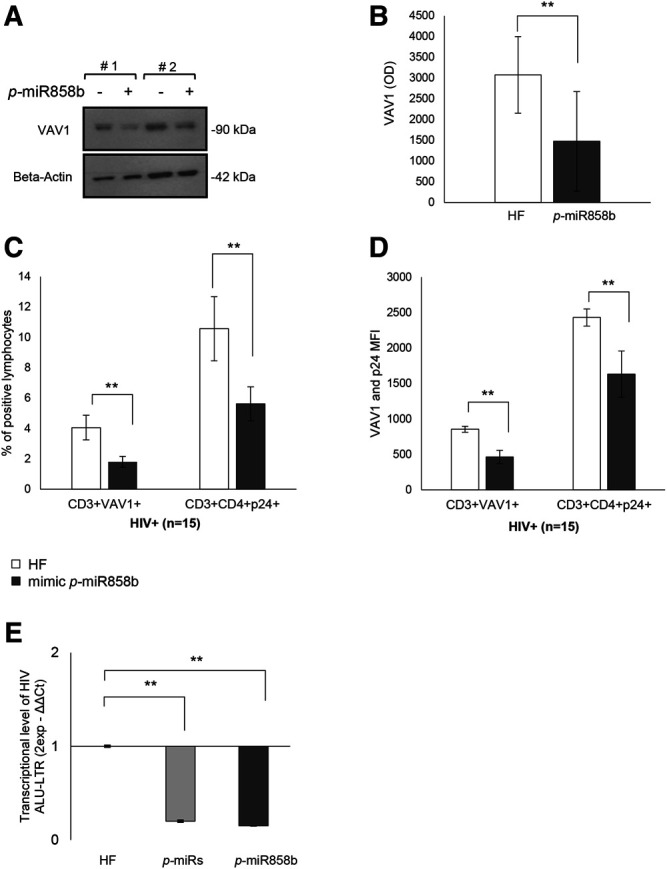
Effect of mimic p-miR858b transfection on VAV1 expression and HIV infection. (A) Representative Western Blot of two HIV+ patient of VAV1 expression level with (+) and without (-) mimic p-miR858b. (B) Densitometry histogram of the mean ± S.D. of 15 HIV+ subjects, with and without mimic p-miR858b. (C) Flow cytometry analysis of the percentage of FITC-VAV1 positive cells. (D) Percentage of p24+ cells, with and without mimic p-miR858b treatment. (E) Fold change of virus integration level, after transfection with p-miRs and mimic p-miR858b. **p < 0.01. All results derived from at least 15 HIV+ samples. The ANOVA-Bonferroni test was used.