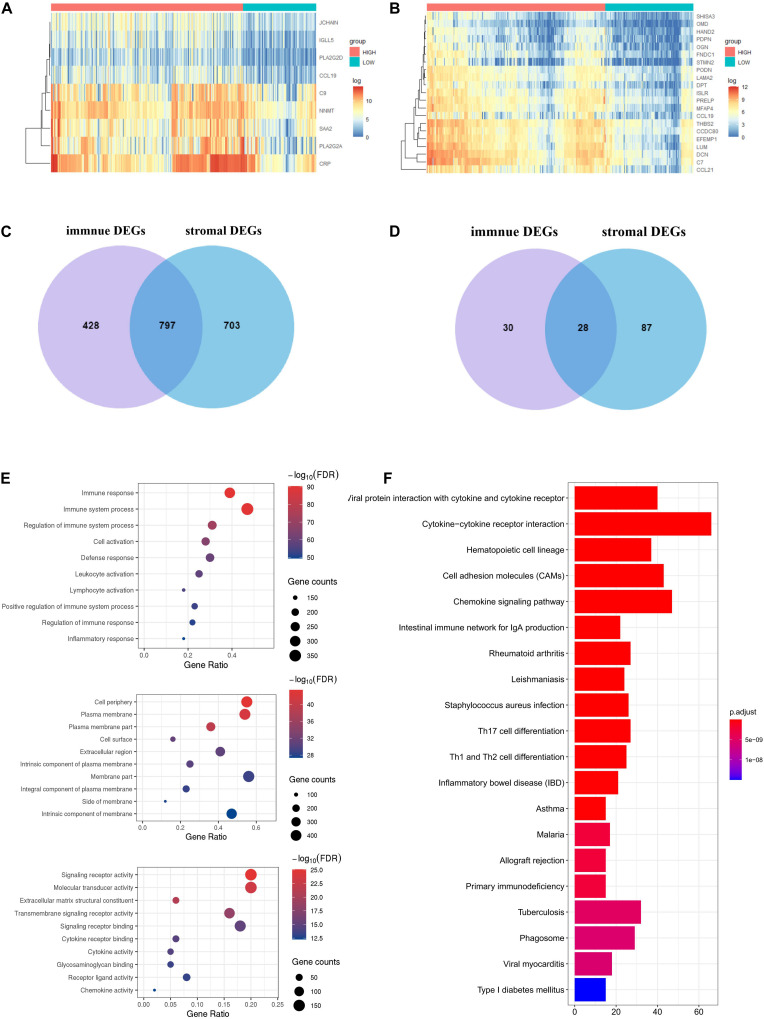
FIGURE 4.
Expression profiles and biological functions of stromal and immune score–related DEGs. (A,B) Heatmaps showing expression profiles for selected stromal score (right) and immune score (left)–related DEGs (Log2 fold change ≥ 3 and adjusted P < 0.05) with unsupervised hierarchical clustering analyses, using the complete linkage method to measure distances between clusters. (C) Shows the commonly upregulated DEGs, and (D) shows the commonly downregulated DEGs. (E) The top 10 of biological processes GO terms (top), cellular component GO terms (middle), and molecular function GO terms (bottom); (F) KEGG (Kyoto Encyclopedia of Genes and Genomes) analysis of microenvironment-related DEGs.

