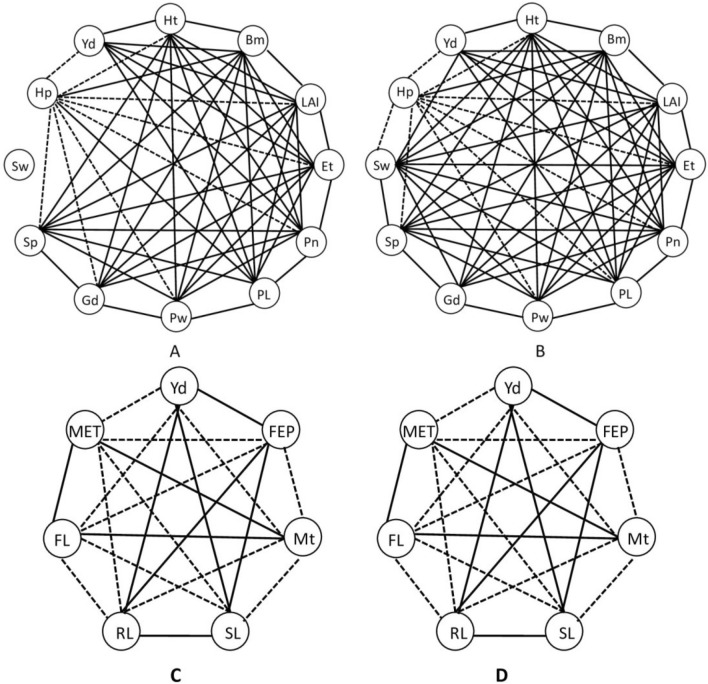
Fig. 13.
Agronomic traits correlation analyses. a, b Pearson’s correlation analysis of 12 agronomic characters obtained after maturity for session 2018 and 2019 respectively. C-D. Pearson’s correlation analysis of 7 agronomic characters obtained from seedlings for session 2018 and 2019 respectively for rice plants cultivated after nanopriming seeds with different concentrations of nZVI. Solid lines represent a significant positive correlation and dashed lines represent a significant negative correlation. Thinner lines indicate significance at the 0.05 level and thicker lines indicate significance at the 0.01 level (Ht: Plant height, Bm: biomass, LA: leaf area, Et: effective tiller number, Pn: total panicle number per m−2, PL: panicle length, Pw: panicle weight, Gd: grain density, Sp: number of seed per panicle, Sw: seed weight, FEP: final emergence percentage, RL: root length, SL: shoot length. MET: mean emergence time, FL: flowering time, Mt: maturity time, and Yd: total yield)

