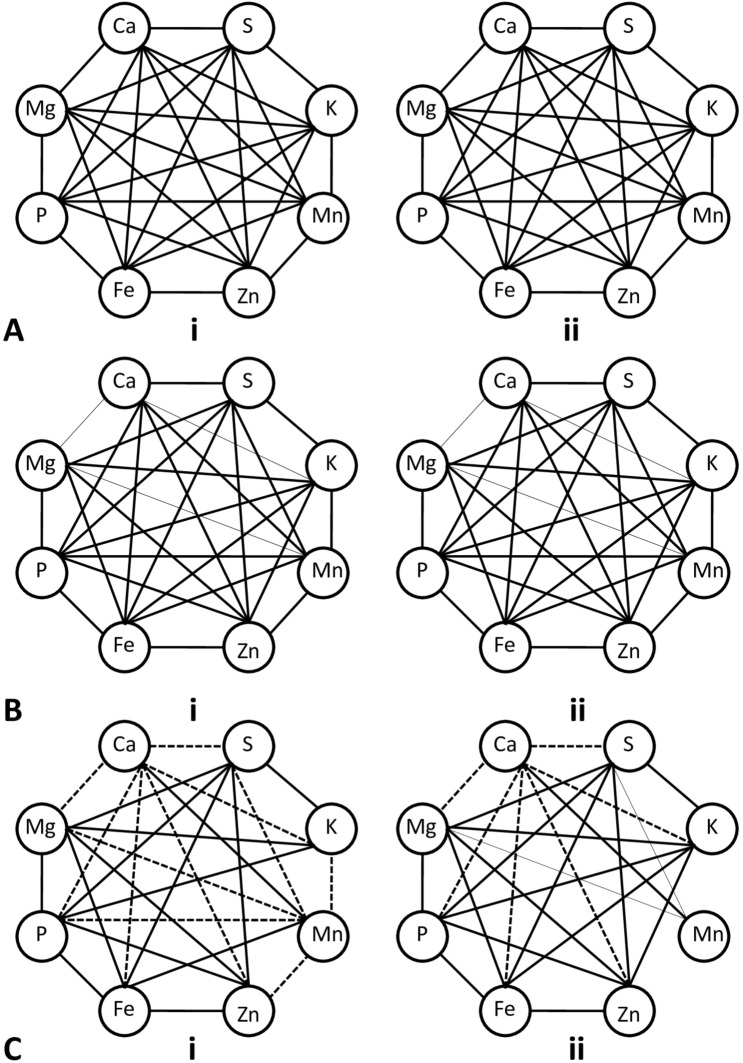
Fig. 14.
Pearson’s correlation analysis of 8 mineral concentrations in grains (a i–ii), shoot (b i–ii), and root (c i–ii), of rice plants grown for session 2018 and 2019 respectively after nanopriming seeds with different concentrations of nZVI. Solid lines represent a significant positive correlation and dashed lines represent a significant negative correlation. Thinner lines indicate significance at the 0.05 level and thicker lines indicate significance at the 0.01 level

