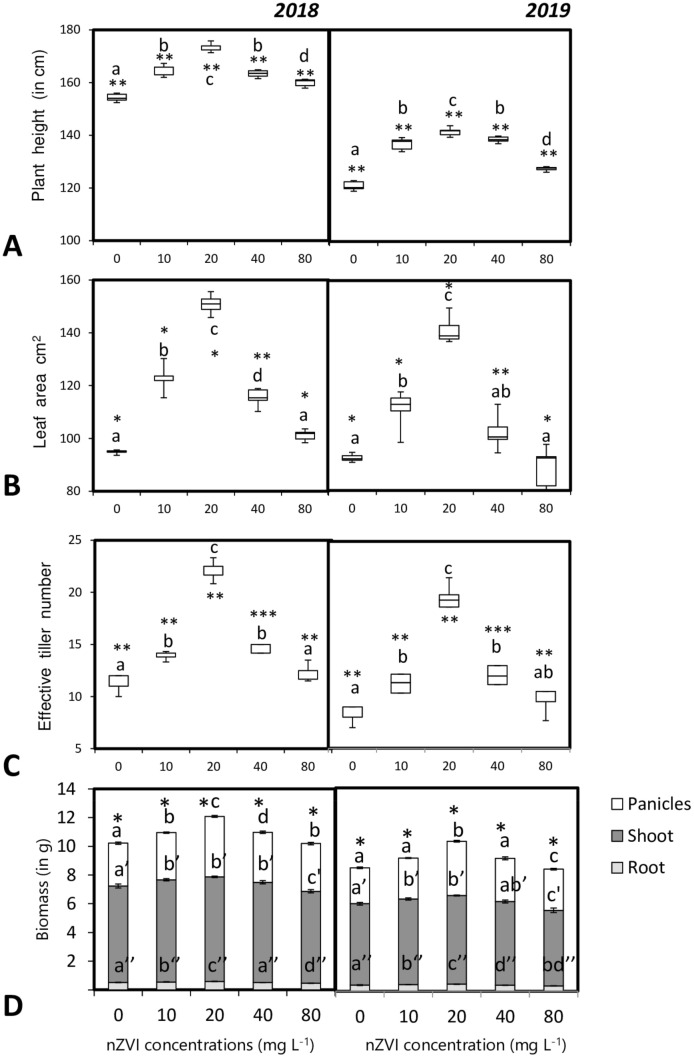
Fig. 5.
Influence of seed priming with different concentrations of nZVI on a plant height, b leaf area, c effective tiller number, d biomass. of rice plants after maturity. Data represent the mean of five replicates and error bars represent standard error. Means with the same letters are not significantly different (Tukey’s HSD multiple comparisons at p ≤ 0.05). Significant differences between session 2018 and 2019 plants are indicated by symbol ‘*’ as obtained from unpaired t test analysis

