Figure 2.
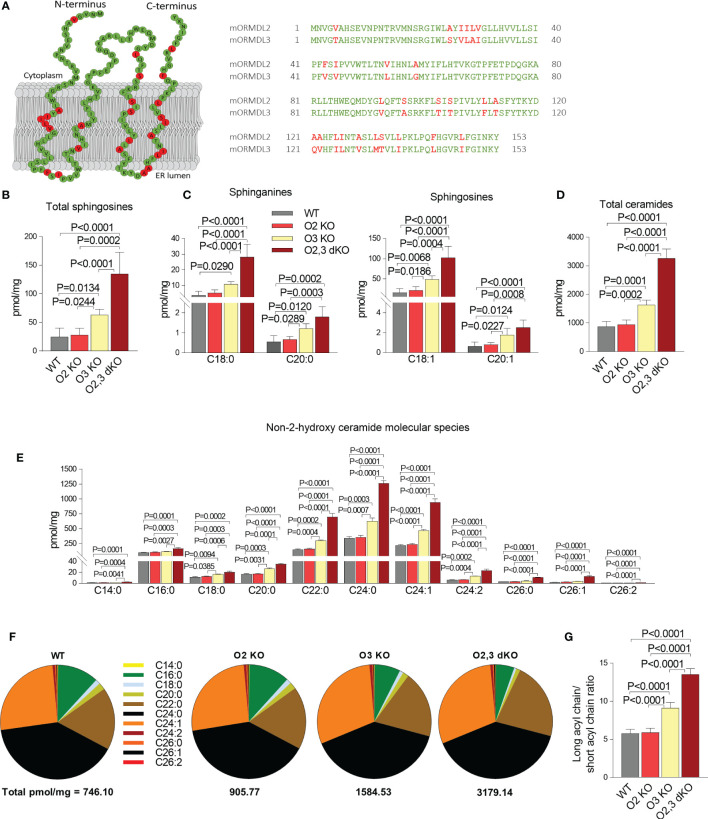
The role of ORMDL2 and ORMDL3 and their redundancy in the metabolism of sphingolipids in BMMCs. (A) Left: predicted topology of murine ORMDL2 based on recently described ORMDL1 topology (46). Residues marked in the murine ORMDL2 by green color indicate conserved amino acids, in red are shown residues which are different in mORMDL3. Right: alignment of primary amino acid sequences of mORMDL2 and mORMDL3. The amino acid replacements were aligned by DNASTAR Lasergene 15. (B–E) LC-ESI-MS/MS analysis of sphingolipids in BMMCs isolated from WT mice (n = 5), O2 KO mice (n = 6), O3 KO mice (n = 5), and O2,3 dKO mice (n = 3). (B) The level of total sphingosines (C18:1, C18:0, C20:1, and C20:0) is presented. (C) The levels of distinct sphinganines C18:0 and C20:0, and sphingosines C18:1 and C20:1 are shown. (D) The levels of total ceramide fatty acid chain molecular species, derived from C18:1 sphingosine. (E) The levels of non-2-hydroxylated ceramide isoforms derived from C18:1 sphingosine. (F) Proportions of individual non-2-hydroxylated ceramide isoforms. (G) Ratio of long acyl chains of all isoforms (C22–C26) and short acyl chains of all isoforms (C14–C20). Quantitative data are mean ± s.e.m., calculated from n, which show numbers of biological replicates. P values were determined by one-way ANOVA with Tukey’s post hoc test.

