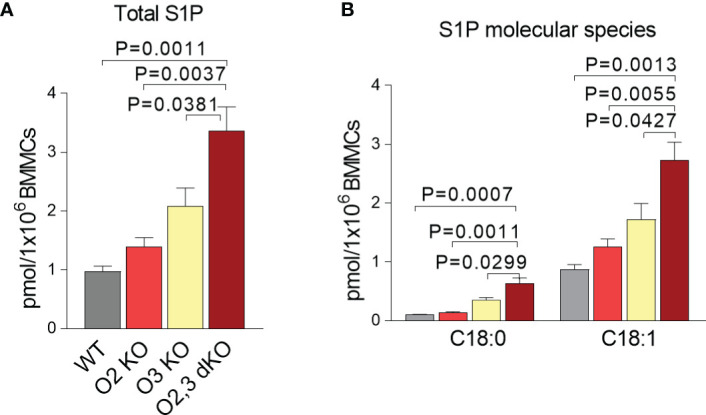
Figure 3.

The intracellular levels of S1P in ORMDL2 and/or ORMDL3 deficient BMMCs. (A, B) LC-ESI-MS/MS analysis of intracellular S1P levels in BMMCs isolated from WT mice, O2 KO mice, O3 KO mice, and O2,3 dKO mice, n = 3 in all groups. (A) The total levels of S1P (C18:1 and C18:0) are presented. (B) The levels of S1P derived from sphinganine C18:0 and sphingosines C18:1 are shown. Quantitative data are mean ± s.e.m., calculated from n, which show numbers of biological replicates. P values were determined by one-way ANOVA with Tukey’s post hoc test.
