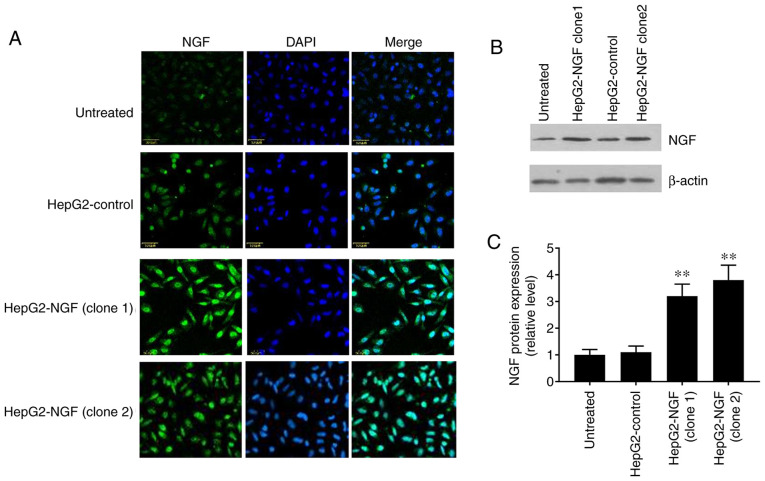
Figure 1.
Overexpression of NGF in HepG2 cells. (A) HepG2 cells were transfected with pcDNA3-control (HepG2-control) and pcDNA3-NGF (HepG2-NGF), immunolabelled with NGF (green) and then imaged with confocal microscopy. Nuclei are stained with DAPI (blue). (B) Representative western blotting image for NGF protein expression with β-actin loading control. (C) Normalized NGF protein signals were analyzed using one-way ANOVA. Scale bar, 50 mm. Data are presented as the mean ± SEM, n=5. **P<0.01 vs. HepG2-control and untreated groups. NGF, nerve growth factor.

