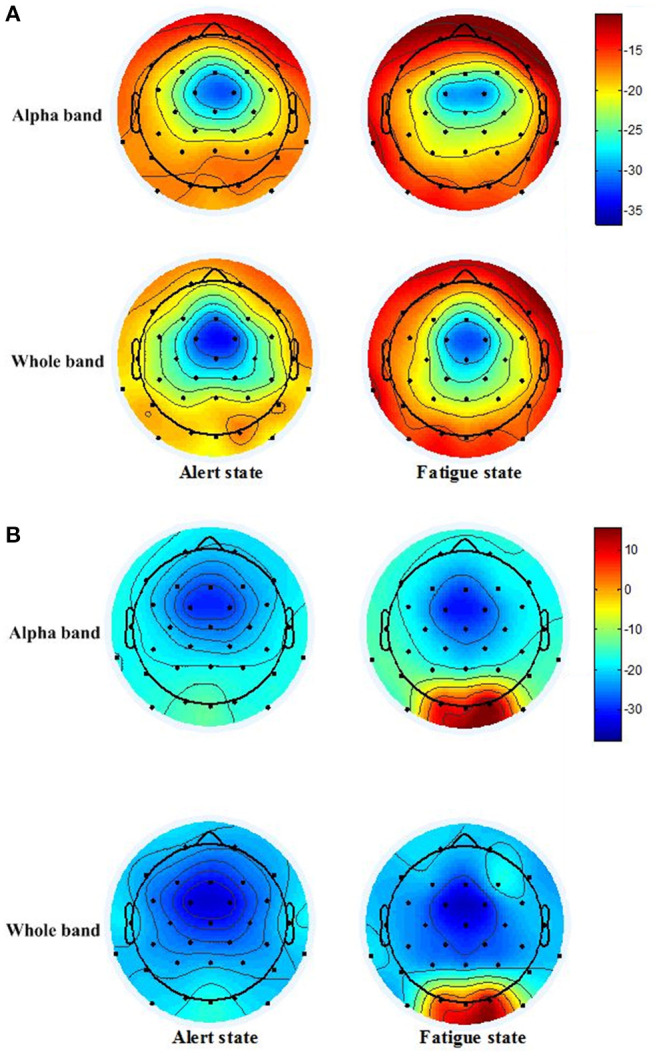
Figure 8.

Power spectral density (PSD) distributions of EEG signals for subjects 1 and 3. (A) PSD distributions of the alpha band of EEG signals in the alert state (a1) and in the fatigue state (a2). PSD distributions of the whole band of EEG signals in the alert state (a3) and in the fatigue state (a4) for subject 1. (B) PSD distributions of the alpha band of EEG signals in the alert state (b1) and in the fatigue state (b2). PSD distributions of the whole band of EEG signals in the alert state (b3) and in the fatigue state (b4) for subject 3.
