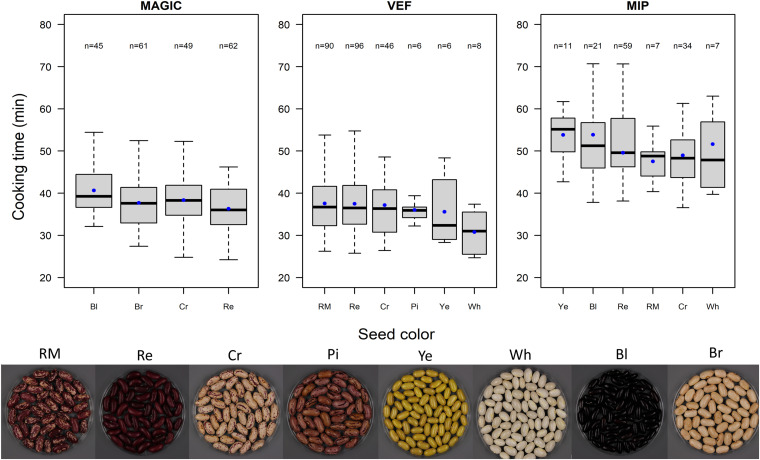
FIGURE 2.
Boxplot of cooking times for the MAGIC population, VEF panel, and MIP panel grouped by seed color. Blue dots represent cooking time averages for each group. Seed color abbreviations are as follows: RM, red mottled; Re, red; Cr, cream; Pi, pink; Ye, yellow; Wh, white; Bl, black; and Br brown.

