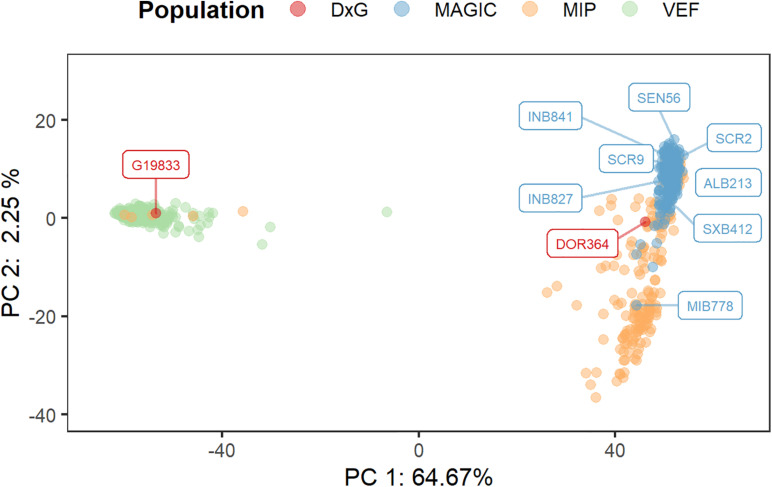
FIGURE 3.
Assessment of population structure by a principal components analysis (PCA) using 17,508 SNP markers from the combined MAGIC, VEF, and MIP lines. The location of each genotype is represented by a point in the two-dimensional space defined by the eigenvectors of the first and second principal components. The founder lines of the MAGIC and DxG populations are represented by colored tags.

