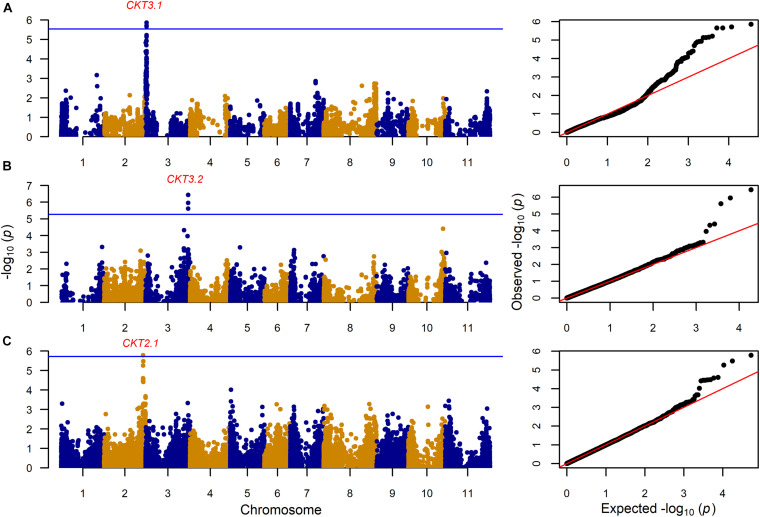
FIGURE 4.
Genome wide association analysis for cooking time (CKT) showing Manhattan and QQ plot for (A): 203 MAGIC RILs with 17,654 markers, (B) 330 VEF lines with 9,420 markers, and (C) 197 MIP lines with 26,500 markers. The Bonferroni correction threshold (p = 0.05) is presented as a blue horizontal line based on the number of markers for each population, respectively.

