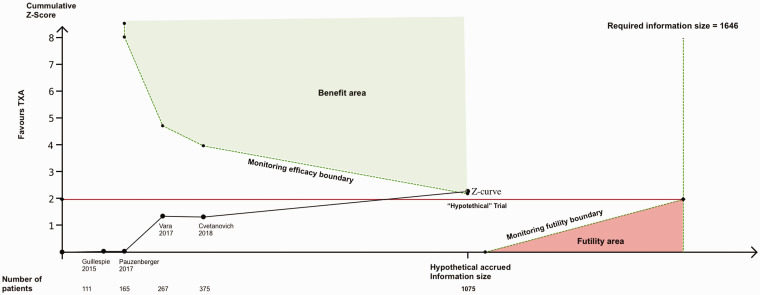
Figure 5.
Trial sequential analysis monitoring boundaries for moderate evidence (α = 5%, β = 20%) after adding a “hypothetical trial” with 700 patients. The cumulative Z-curve (black solid line) crossed the monitoring efficacy boundary after adding a “hypothetical trial” with an intervention effect estimate of a 60% relative risk reduction, a transfusion rate of 3.57% in the control group and 700 patients (350 in each group). This result demonstrates that under the event rate assumptions made for the sample size calculation, a new trial would need to include 700 patients (350 in each group) to make the meta-analysis conclusive with moderate statistical support.

