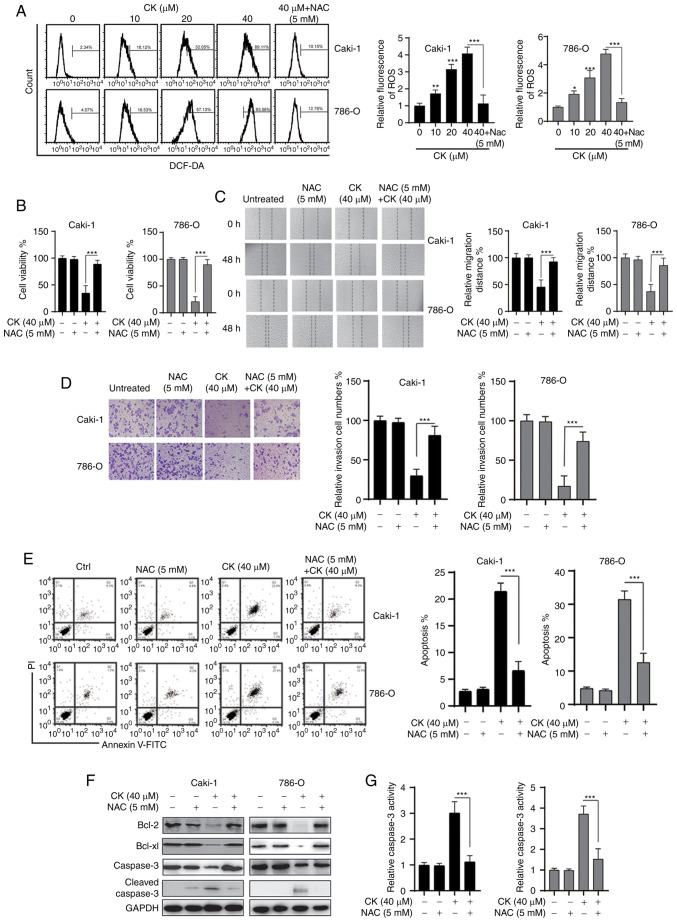
Figure 4.
CK treatment leads to the generation of ROS in renal cell carcinoma cells. (A) Intracellular ROS levels were measured by flow cytometry. (B) Cell viability was measured via an MTT assay. (C) Cell migration was measured by a wound healing assay. (D) Cell invasion was measured via a Transwell invasion assay. (E) Cellular apoptosis was measured. (F) The indicated proteins were measured via western blotting. (G) Caspase-3 activity was analysed. The data are presented as the mean ± SD of at least three independent experiments. *P<0.05, **P<0.01 and ***P<0.001 vs. control group or as indicated. CK, ginsenoside compound K; ROS, reactive oxygen species.

