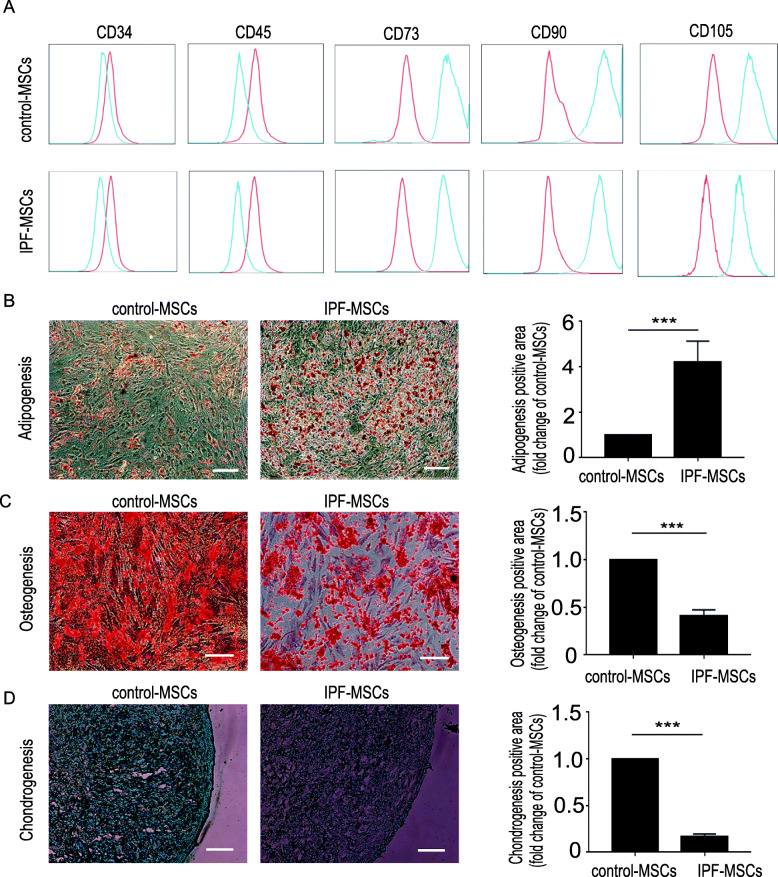
Fig. 1.
Characterization of control-MSCs and IPF-MSCs. a Surface markers of control-MSCs and IPF-MSCs were evaluated by flow cytometry. Both control-MSCs and IPF-MSCs expressed CD73, CD90, and CD105 but not CD34 or CD45. b Adipogenic differentiation evaluated by Oil Red staining and quantification of adipogenic efficiency in control-MSCs and IPF-MSCs. c Osteogenic differentiation determined by Alizarin red staining and quantification of osteogenic efficiency in control-MSCs and IPF-MSCs. d Chondrogenic differentiation determined by Alcian blue staining and quantification of chondrogenic efficiency in control-MSCs and IPF-MSCs. All data were obtained from at least three independent experiments and each error bar represents the mean ± SEM. Scale bar = 200 μm. ***p < 0 .001

