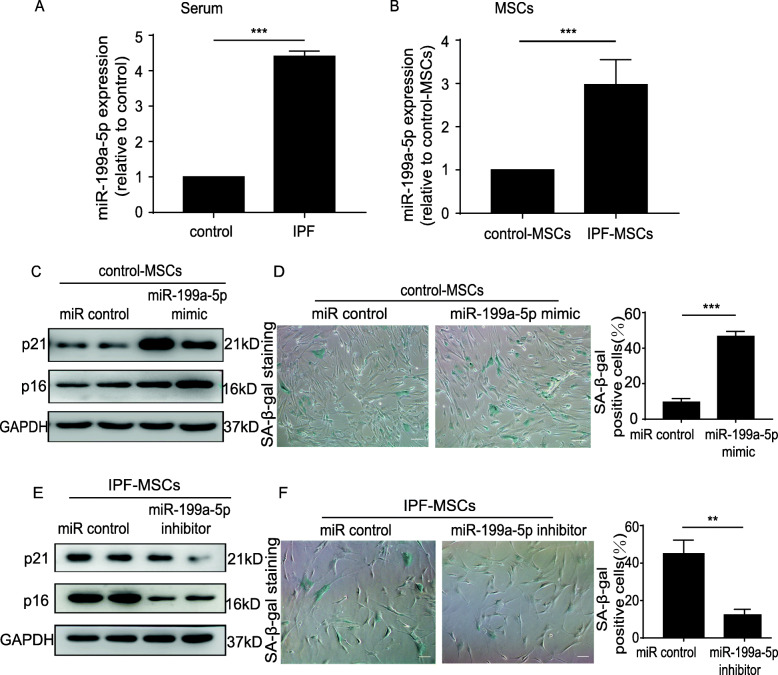
Fig. 3.
miR-199a-5p induced cellular senescence of MSCs. a Expression of miR-199a-5p measured in serum from control donors and patients. b Expression of miR-199a-5p measured in control-MSCs and IPF-MSCs. c Western blotting analysis of p21 and p16 protein expression in control-MSCs treated with miR control or miR-199a- 5p mimic. d Representative images and quantitative analysis of SA-β-gal staining in control-MSCs transfected with miR control or miR-199a-5p mimic. Scale bar = 200 μm. e Western blotting analysis of p21 and p16 protein expression in IPF-MSCs treated with miR control or miR-199a- 5p inhibitor. f Representative images and quantitative analysis of SA-β-gal staining in IPF-MSCs transfected with miR control or miR-199a-5p inhibitor. Scale bar = 200 μm. All data were obtained from at least three independent experiments and each error bar represents the mean ± SEM. **p < 0.01; ***p < 0.001

