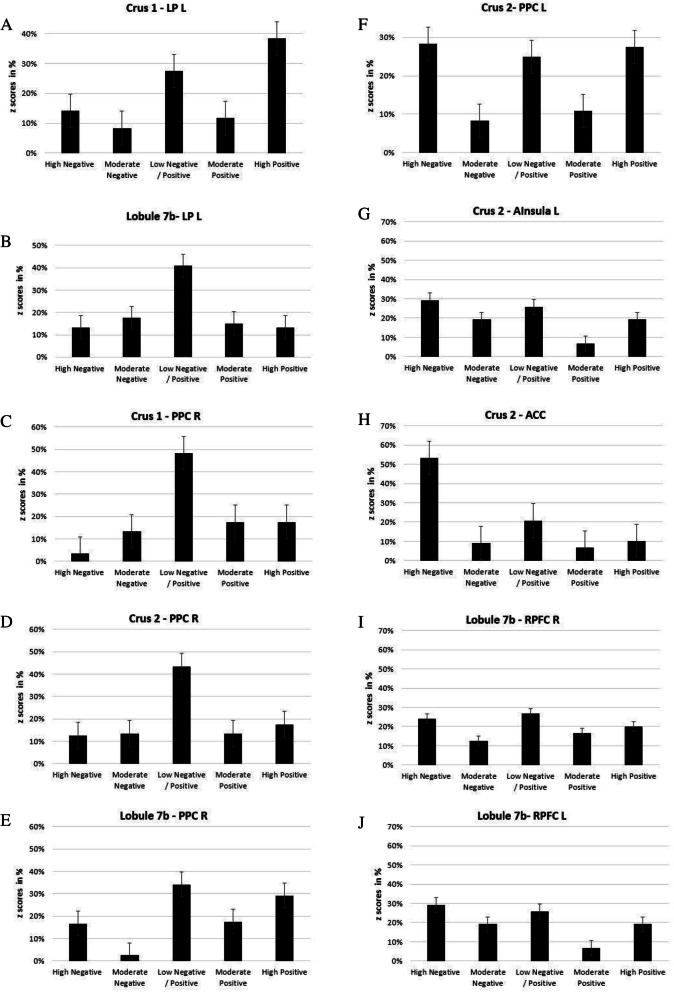
Fig. 2.
Histograms describing the proportion of windows in which the z-scores fell within particular ranges for the N = 12 subjects: high negative (z < −0.5), moderate negative (−0.5 < z < −0.25), low negative/positive (−0.25 < z < 0.25), moderate positive (0.25 < z < 0.5), and high positive (z > 0.5). a-b, z-score distribution between crus 2/7b and left LP. c-d-e, z-score distribution between crus 1–2/7b and right PPC. f, z-score distribution between crus 2 and left PPC. g, z-score distribution between crus 2 and left anterior insula. H, z-score distribution between crus 2 and right PFC; i, z-score distribution between right lobule 7B and right PFC j, z-score distribution between right lobule 7B and left PFC

