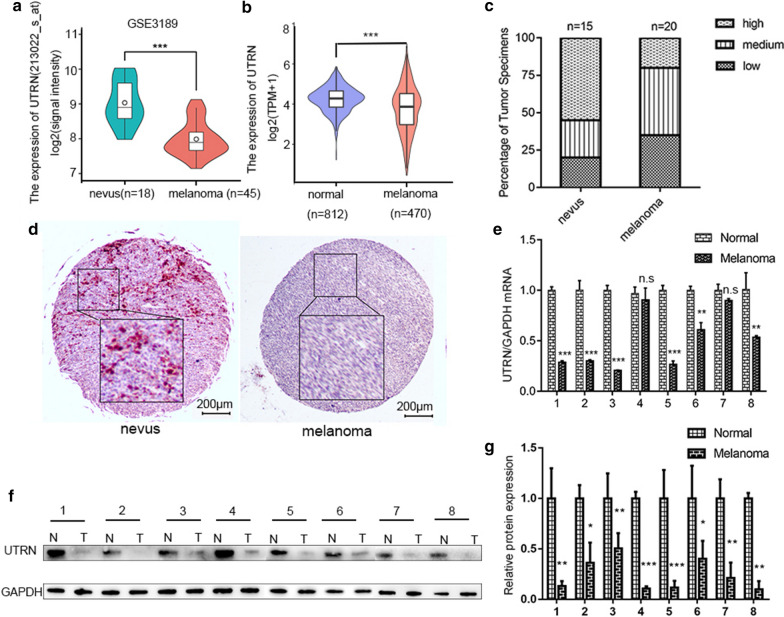
Fig. 1.
Decreased UTRN expression in melanoma. a Analysis of UTRN expression in nevus tissues (n = 18) and melanoma (n = 45) in GEO database (GSE3189) (P < 0.001). b Analysis of UTRN expression in normal skin (n = 812) and melanoma (n = 470) from UCSC XENA platform (P < 0.001). c, d Melanoma tissues (n = 20) presented lower expression of UTRN while benign nevus (n = 15) showed higher expression by IHC staining. e–g UTRN expression levels measured in 8 paired clinical samples by qRT-PCR (e) and Western Blot (f, g). IHC stain, AEC, scale bar represents 200 μm. Bars represent mean ± SD; n.s not significant, IHC immunohistochemistry. *P ≤ 0.05, **P ≤ 0.01, ***P ≤ 0.001

