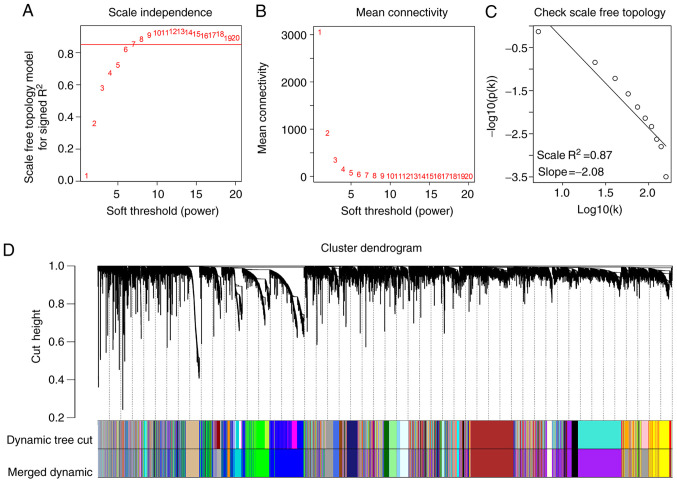
Figure 2.
Weighted gene co-expression network analysis. (A) Analysis of the scale-free fit index for various β soft-thresholding powers. (B) Analysis of the mean connectivity for various soft-thresholding powers. (C) Scale-free topology when β=7. (D) Dendrogram of all genes clustered based on a dissimilarity measure (1-topological overlap matrix). There were 27 gene co-expression modules in total (paleturquoise, cyan, salmon, sienna3, violet, royalblue, saddlebrown, darkmagenta, brown, black, purple, lightyellow, darkolivegreen, grey60, yellow, darkgreen, skyblue, lightcyan, lightgreen, tan, darkturquoise, darkorange, blue, green, steelblue, darkgrey and midnightblue). Genes without co-expression were clustered into the grey module.

