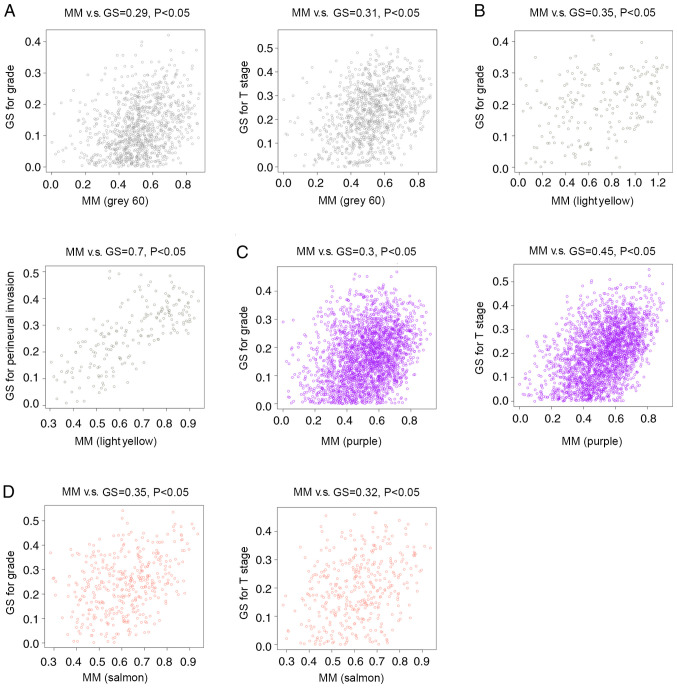
Figure 4.
Analysis of GS and MM in the clinically significant modules. (A) MM of the grey60 module was correlated with GS for tumor grade and T stage. (B) MM in the lightyellow module was correlated with GS for tumor grade and perineural invasion. (C) MM of the purple module was correlated with GS for tumor grade and T stage. (D) MM of the salmon module was correlated with GS for tumor grade and T stage. GS, gene significance; MM, module membership; cor, correlation; T, tumor; N, node.

