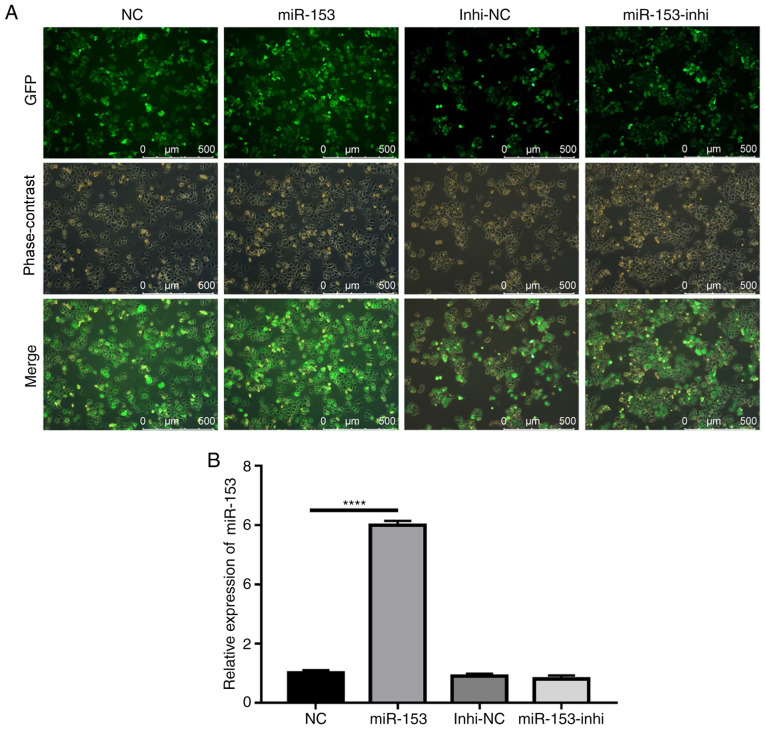
Figure 2.
Establishment of stably transduced SW1990 cell lines. (A) Representative images showing GFP expression in stably transduced cells. (B) Reverse transcription-quantitative PCR analysis of miR-153 expression levels in the stably transduced cell lines. ****P<0.0001. miR-153, microRNA-153; GFP, green fluorescent protein; NC, negative control; Inhi, inhibitor.

