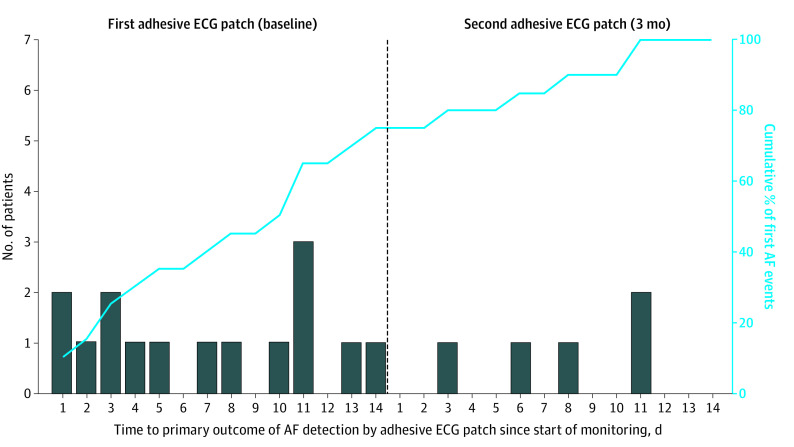
Figure 3. Time Course of Atrial Fibrillation (AF) Detection by Continuous Electrocardiographic (cECG) Monitoring in the Screening Group.
The bars show when AF was first detected for each of the 20 patients with cECG-detected AF during the first (A) and second (B) monitoring periods. The curve shows the cumulative incidence of AF. Of the 20 AF cases, 8 (40%) were detected within the first week of cECG monitoring, 15 (75%) were detected within 2 weeks, 17 (85%) were detected within 3 weeks, and 3 (15%) were first detected only during the fourth week; 18 (90%) of AF cases were first detected after the first 24 hours of monitoring.

