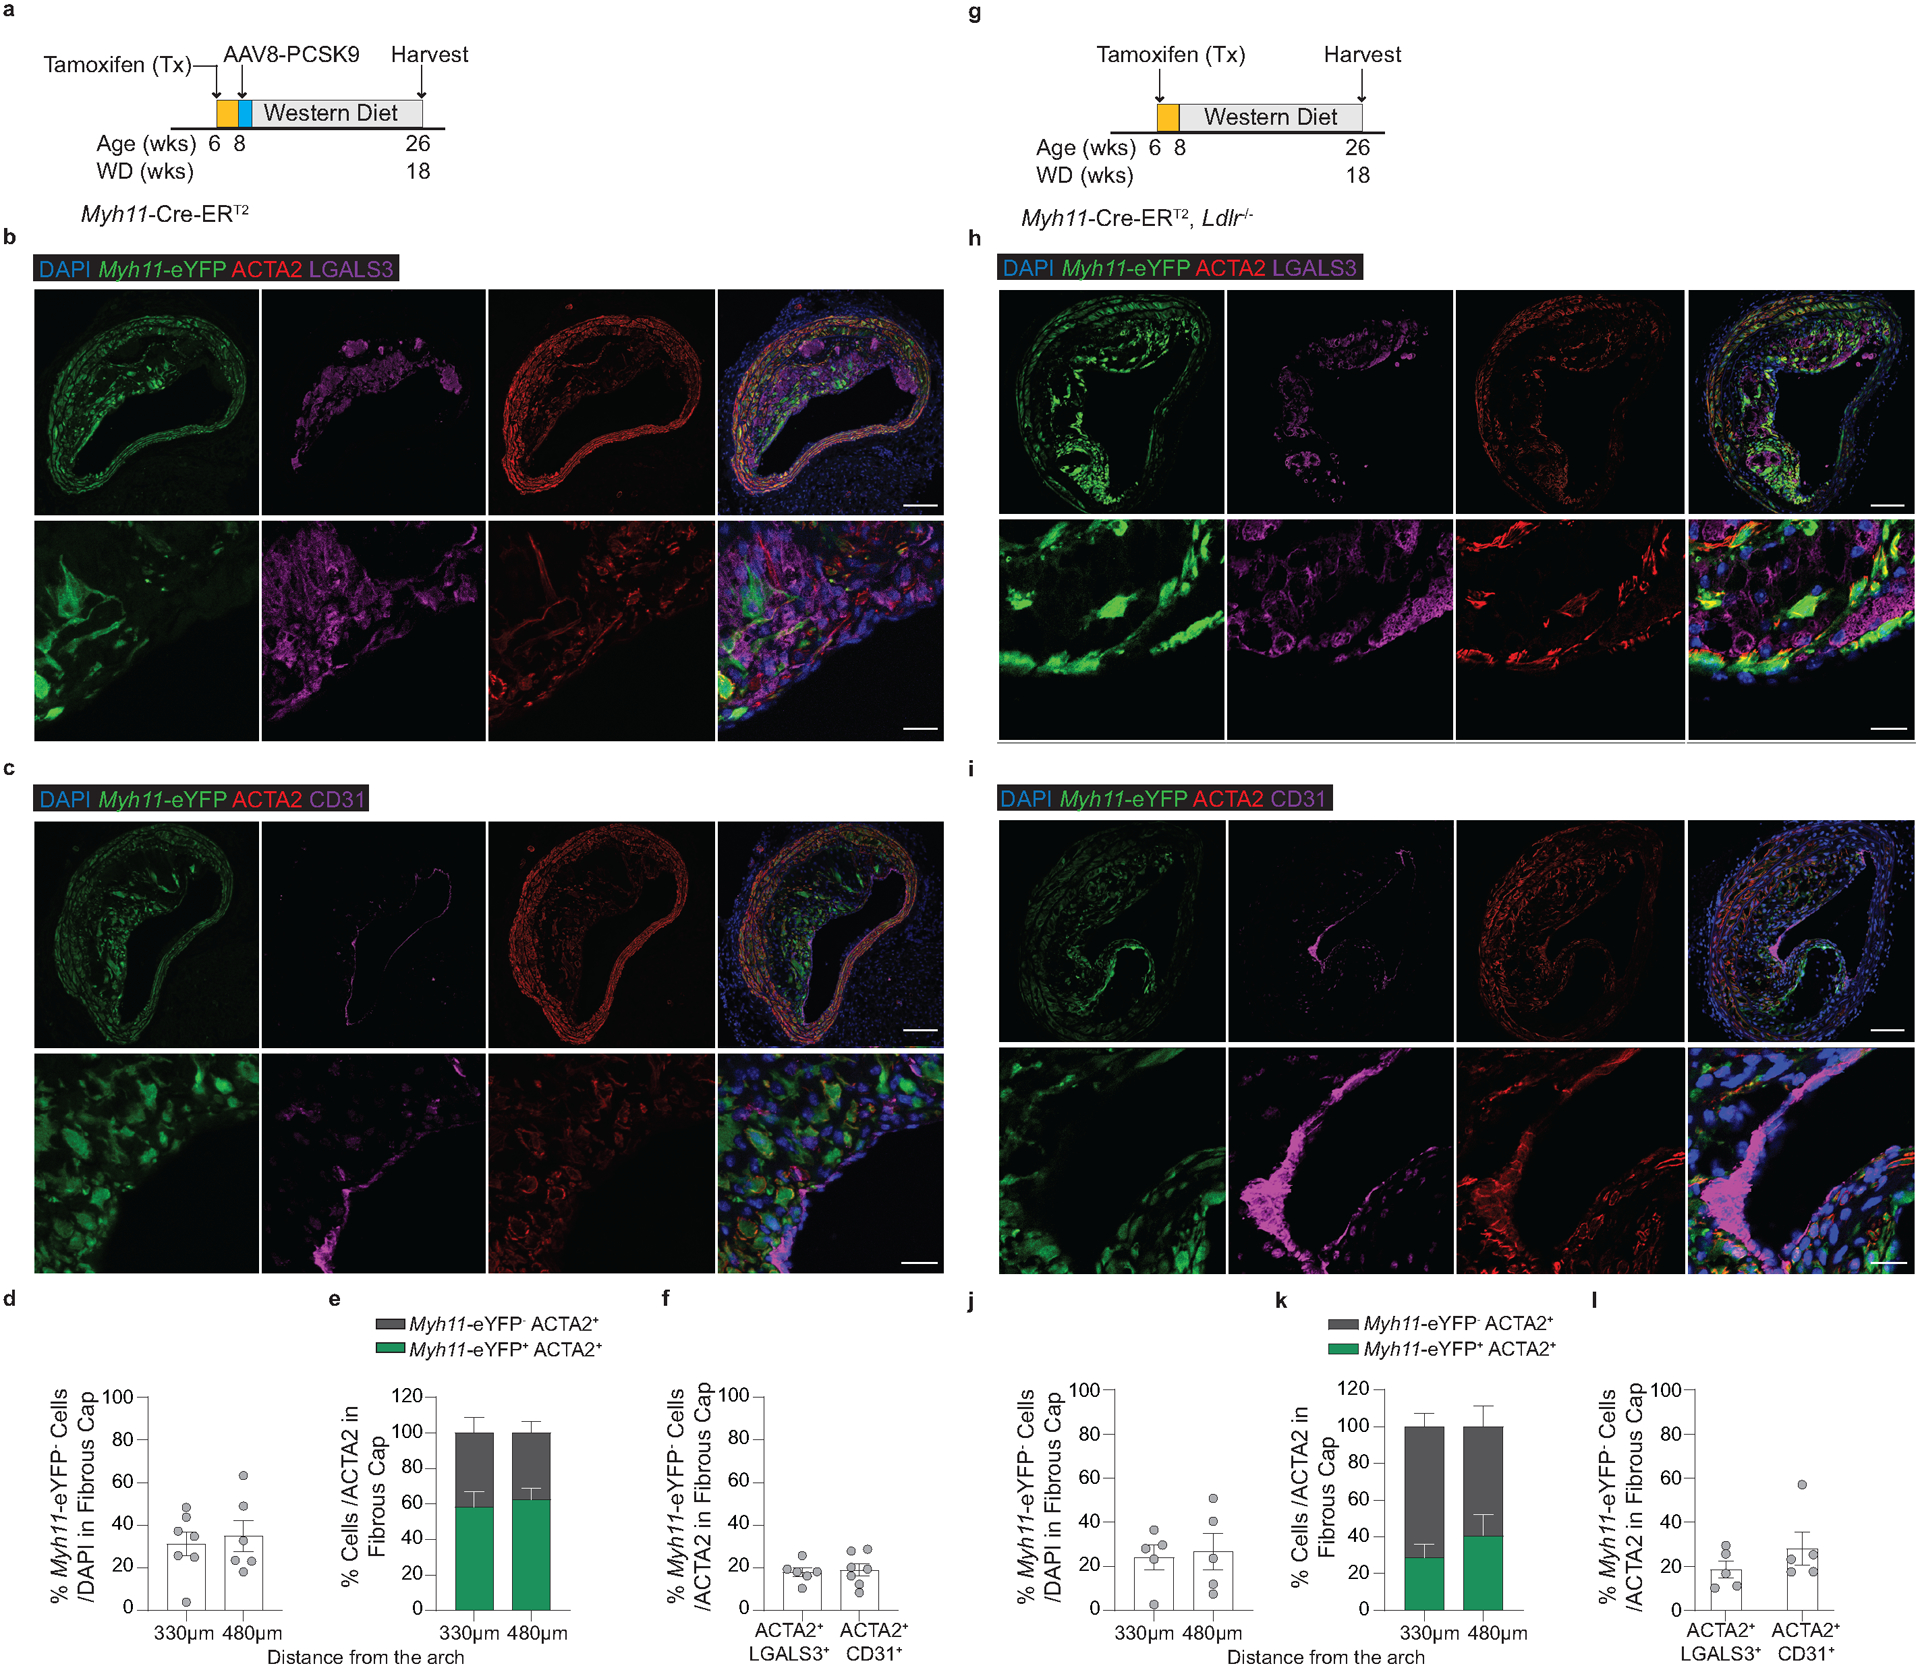
Extended Data Fig. 5. Analysis of BCA lesions from gain of function mutant (m) PCSK9-AAV8 and Ldlr−/− models of murine atherosclerosis.

(A) Schematic of experimental design for experiments using Myh11-CreERT2/ROSA-STOPFL/FL-eYFP mice infected once with mPCSK9-AAV8 (Myh11-CreERT2 mPCSK9). Representative images depicting (B) EndoMT (eYFP− ACTA2+ CD31+ /ACTA2+) and (C) MMT (eYFP− ACTA2+ LGALS3+ /ACTA2+). (D) Quantification of Myh11-eYFP+ cells in the 30μm fibrous cap area. (E) Quantification of the percentage of ACTA2+ cells derived from SMC (Myh11-eYFP+ ACTA2+) and from non-SMC sources (Myh11-eYFP−ACTA2+) in Myh11-CreERT2 mPCSK9 mice. (F) Quantification of MMT and EndoMT from (B & C). (G) Schematic of Ldlr−/− Myh11-CreERT2/ROSA-STOPFL/FL-eYFP (Myh11-CreERT2 Ldlr−/−) experimental design. Representative images depicting (H) EndoMT (Myh11-eYFP− ACTA2+ CD31+ /ACTA2+) and (I) MMT (Myh11-eYFP− ACTA2+ LGALS3+ /ACTA2+). (J) Quantification of Myh11-eYFP+ cells in the 30μm fibrous cap area. (K) Quantification of the percentage of ACTA2+ cells derived from SMC (Myh11-eYFP+ ACTA2+) and from non-SMC sources (Myh11-eYFP− ACTA2+) in Myh11-CreERT2 Ldlr−/− mice. (L) Quantification of MMT and EndoMT from (H) & (I). Scale bar: 100μm (B, C, H, I top) or 20μm (B, C, H, I bottom). Biologically independent animals are indicated as individual dots in (D, F, J, L), (E) n = 7, 6 (WT and KO: 330, 480μm), (K) n=5 (WT and KO), error bars represent mean ± SEM.
