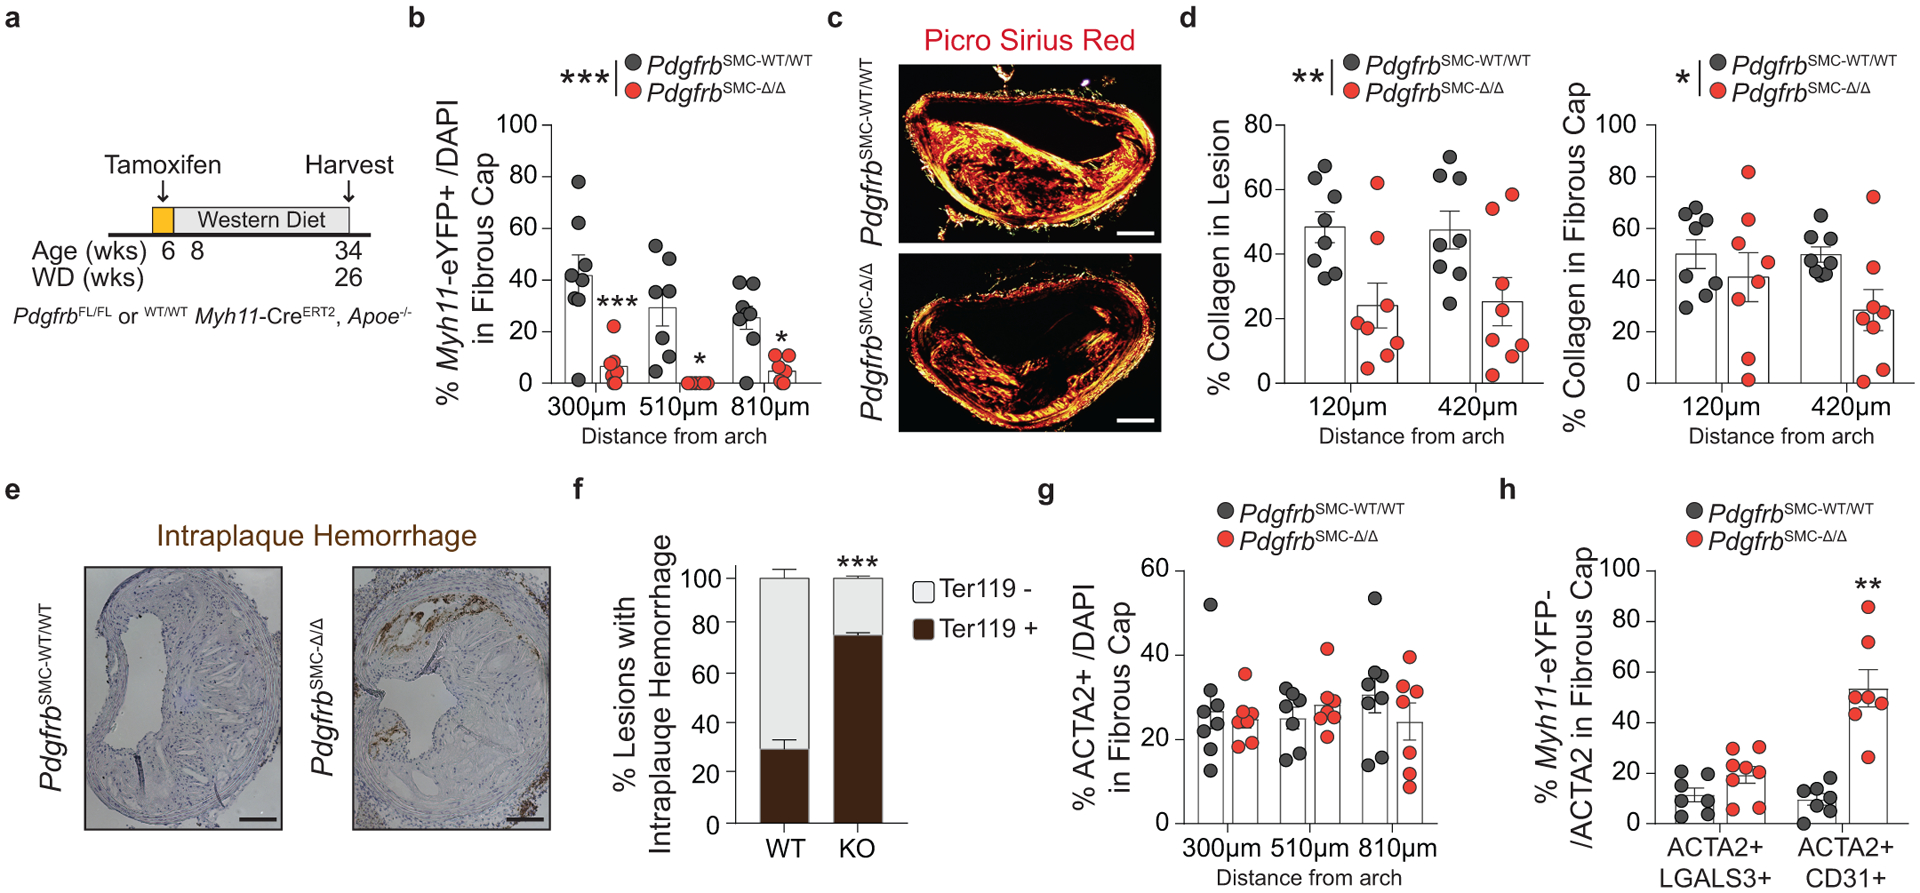
Figure 4: After 26 weeks of WD feeding, PdgfrbSMC-Δ/Δ mouse lesions lack SMC investment and have reduced indices of lesion stability.

(A) After 26 weeks of WD, (B) PdgfrbSMC-WT/WT mice exhibited robust SMC accumulation within the fibrous cap, which was reduced by more than 90% in PdgfrbSMC-Δ/Δ mice. ***p-value < 0.0001. (C) Representative PSR images and (D) quantification of collagen in the lesion, **p-value = 0.001, and fibrous cap, *p-value < 0.0368, demonstrated significantly reduced collagen content. (E) Representative Ter119 staining and (F) quantification of intraplaque hemorrhage in the lesion showed significantly increased Ter119 staining over three locations. ***p-value of interaction < 0.0001. (G) Despite loss of SMC, there were no changes in the percentage of total ACTA2+ cells within the fibrous cap at 26 weeks of WD, likely due to compensatory increases in EndoMT, **p-value = 0.0006, and MMT, p-value = 0.0876, as assessed by marker protein staining (H). X-axis values represent distance past the aortic arch. Scale bar: 100μm. Graphs were analyzed using two-tailed Mann-Whitney U test (H) or two-way ANOVA with Sidak correction and multiple comparisons (B, D, F, G), biologically independent animals are indicated as individual dots in (B, D, G, H), intraplaque hemorrhage was analyzed as either positive or negative staining and n = 6, 8, 8 (WT: 270, 570, 870 μm) or n = 9 (KO) in (G), error bars represent mean ± SEM, p-values displayed refer to two-way ANOVA between genotype unless otherwise indicated.
