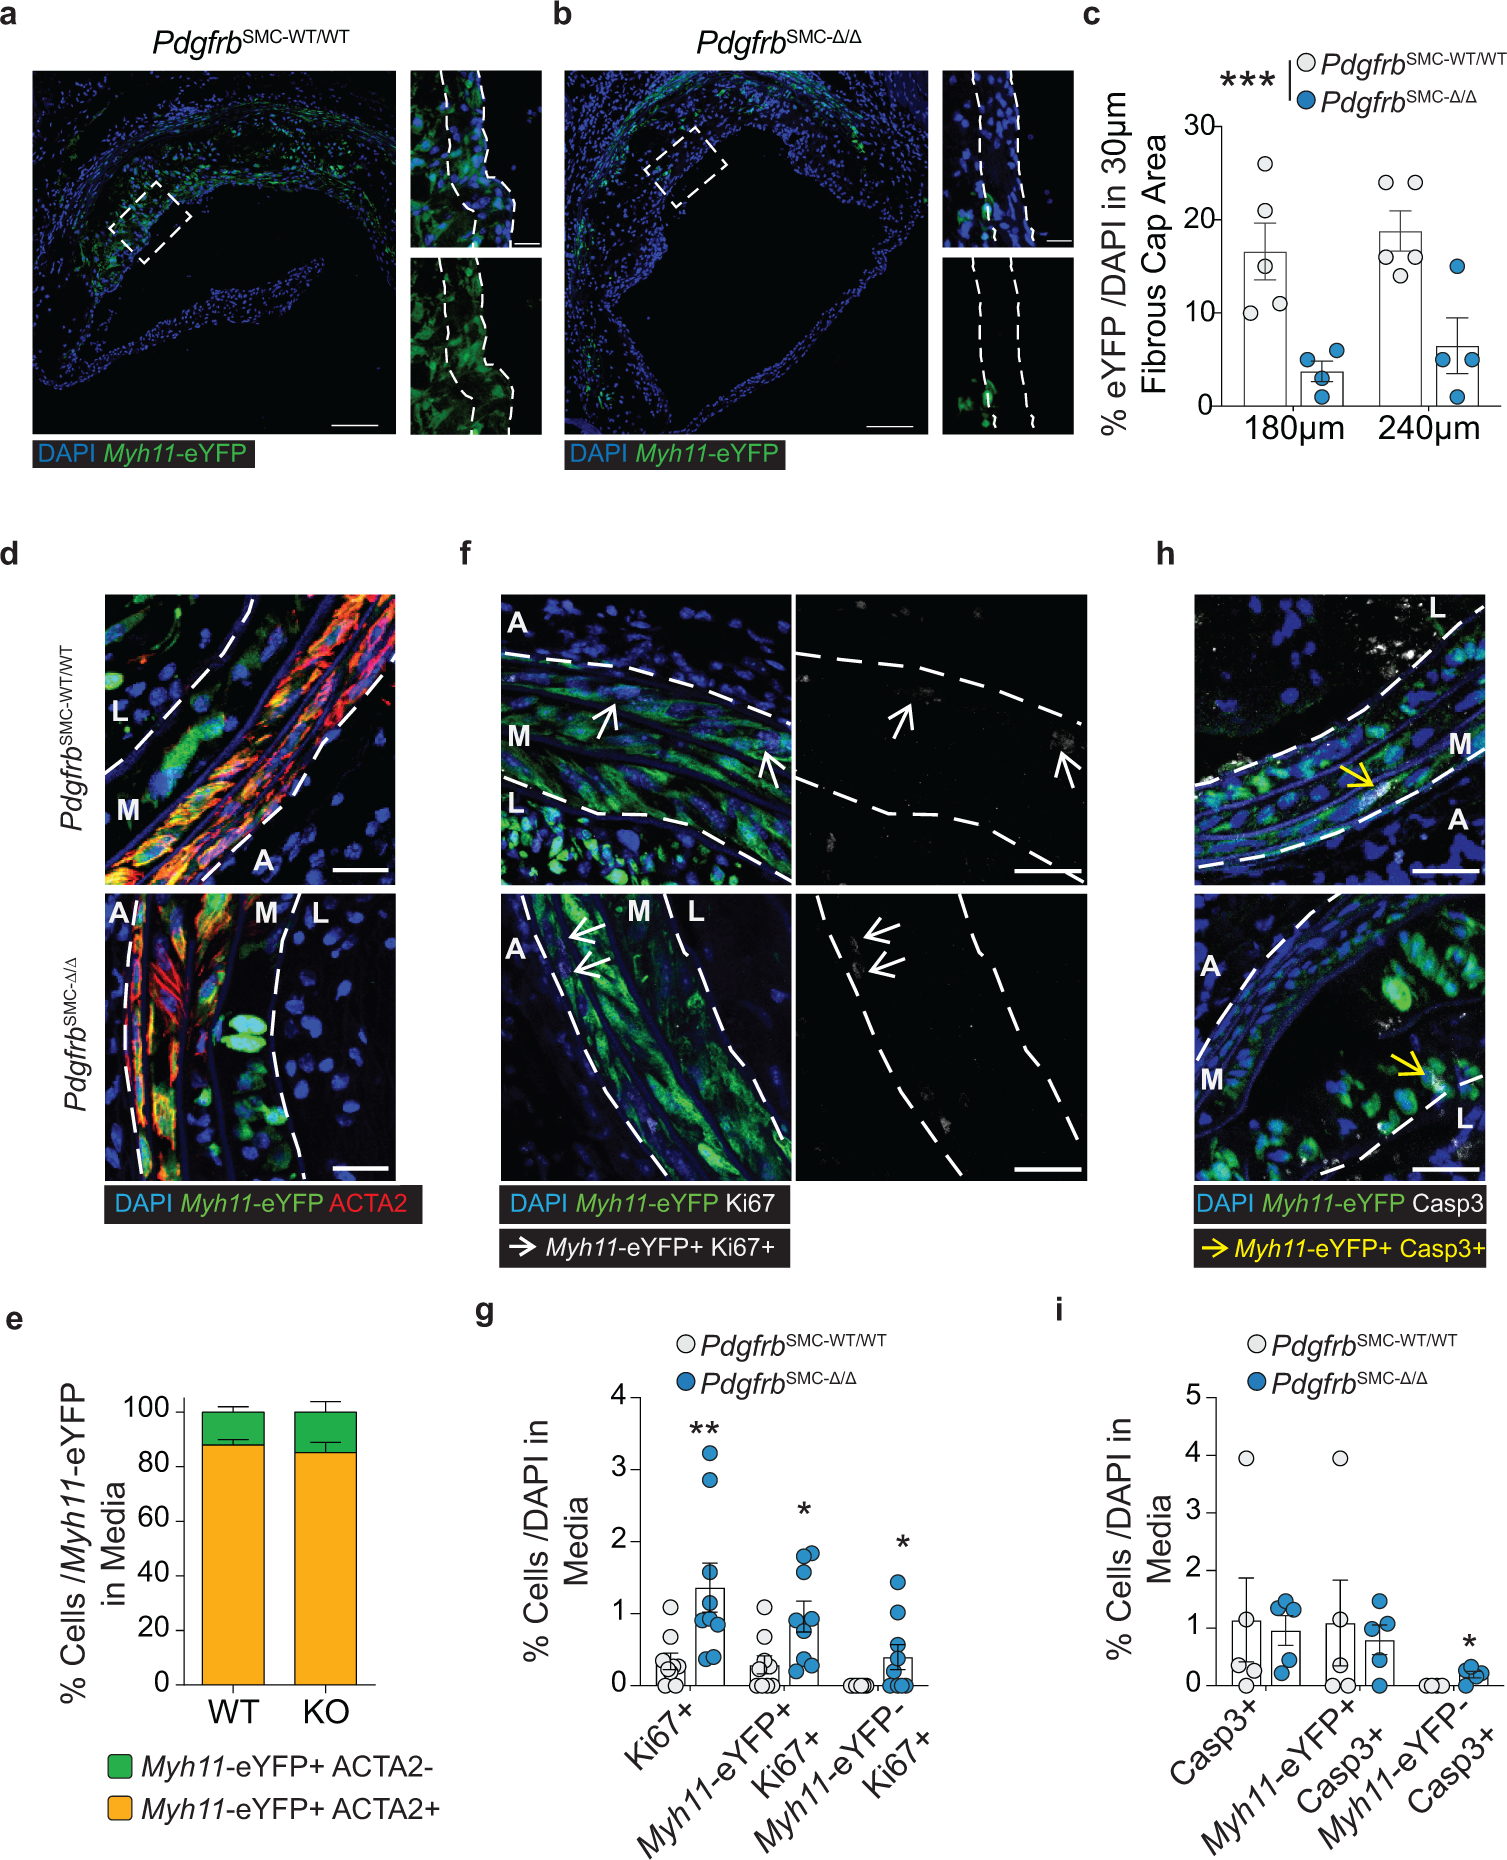
Extended Data Fig. 2. SMC investment is significantly impaired in the aortic root of PdgfrbSMC-Δ/Δ mice and SMC-PDGFRB KO did not show reduced dedifferentiation, proliferation, or apoptosis of medial SMC following 18 weeks of WD.

(A) Representative images of aortic root lesions from PdgfrbSMC-WT/WT and (B) PdgfrbSMC-Δ/Δ mice. (C) Quantification of Myh11-eYFP+ cells content in the fibrous caps of aortic root lesions from PdgfrbSMC-WT/WT and PdgfrbSMC-Δ/Δ mice, demonstrated a significant reduction in SMC-derived cells in aortic root lesions. ***p-value = 0.0002. (D) Representative image of the media from the BCA of PdgfrbSMC-WT/WT and PdgfrbSMC-Δ/Δ mice show ACTA2 downregulation in the innermost layer of the media. (E) Quantification of Myh11-eYFP+ACTA2+ cells in the media. (F) Representative image of Ki67 staining in Myh11-eYFP+ SMC in the media. (G) Quantification of Ki67 expression in the media, representing proliferation. Ki67+: **p-value = 0.0017, Myh11-eYFP+ Ki67+ *p-value = 0.0130, Myh11-eYFP− Ki67+ *p-value = 0.0337. (H) Representative image of cleaved caspase 3 staining in Myh11-eYFP+ SMC in the media. Myh11-eYFP− Casp3+ p-value = 0.0476. (I) Quantification of Casp3 expression in the media, representing apoptosis. *p-value = 0.0476. A: Adventitia, M: Media, L: Lesion. Scale bar: 100μm (whole lesion) or 20μm (zoom). Graphs were analyzed using Graphs were analyzed using two-way ANOVA with Sidak correction and multiple comparisons or two-tailed Mann-Whitney U test, biologically independent animals are indicated as individual dots in (C, H, I), n = 8 (WT and KO) in (G), error bars represent mean ± SEM.
