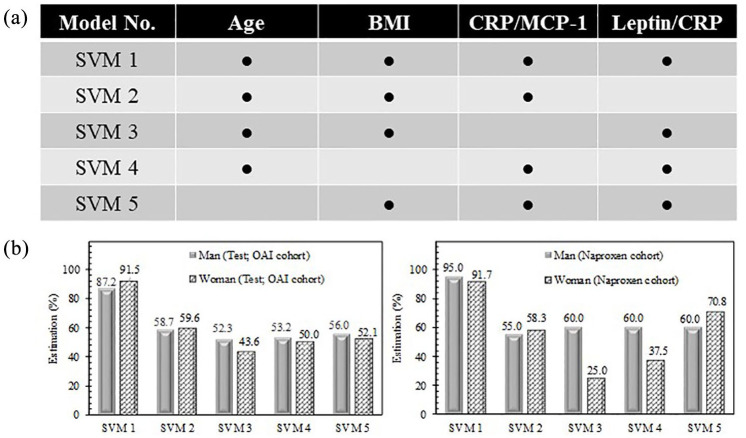
Figure 4.
Effect of each variable in probability values. (a) SVM models 1–5 are designed as a function of selected features. (b) Performance of developed models for progressors and no-progressors together for OAI test stage and Naproxen cohorts. Percent estimation is ratio of corrected classified participants on total number.
BMI, bone mass index; CRP, C-reactive protein; MCP-1, monocyte chemoattractant protein-1; OAI, osteoarthritis initiative; SVM, support vector machine.

