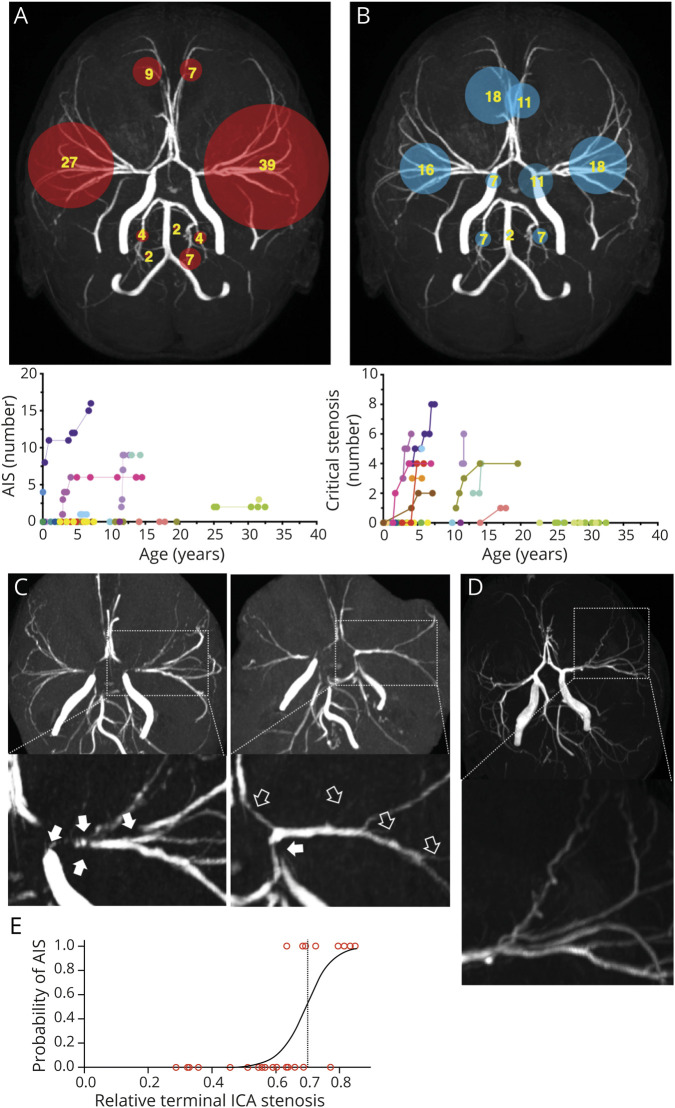
Figure 5. Vascular Lesions in Patients With ACTA2 Arg179.
A) Frequencies of involved vascular territories of ischemic strokes related to large artery occlusion (AIS) and longitudinal data on numbers of AIS. (B) Frequencies of critical stenosis (CS) within the vascular territories and longitudinal data on number of CS. Numbers in circles indicate percentage of total lesions detected in the cohort. Circle size is proportional to lesion frequency. (C) Representative magnifications of maximum intensity projections of time of flight angiographies (TOF MIP) of the same patient illustrating the emergence of new CS defined as short segmented or wide-stretching signal loss following the vessels course from baseline (white arrows) to follow-up (black arrows). (D) Magnifications of TOF MIP illustrating corkscrew appearance of cerebral vessels found frequently in patients with ACTA2 Arg179 pathogenic variants. (E) Logistic regression curve representing an estimate of the probability for AIS depending on the relative terminal internal carotid artery (ICA) stenosis.

