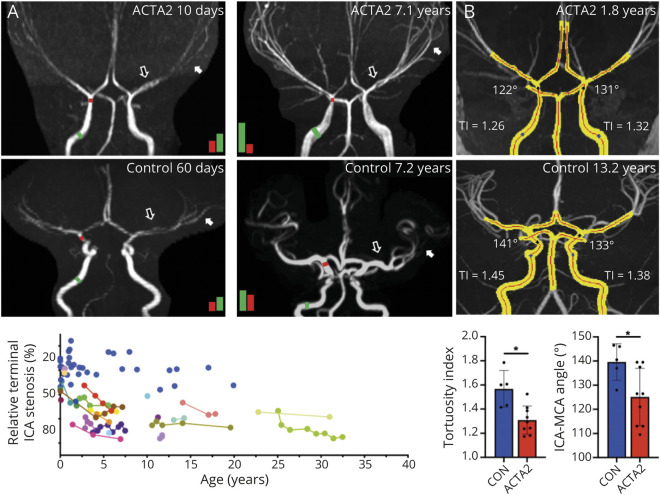
Figure 7. Cerebral Artery Vasculopathy Is Progressive in Patients With ACTA2 Arg179.
A) Segmented maximum intensity projections (MIPs) of an ACTA2 p.Arg179His patient and a patient with pediatric stroke without vasculopathy (control). The red line is the automatically generated centerline. Tortuosity index (TI) is labeled of each internal carotid artery (ICA), and the angle of incidence between the ICA and middle cerebral artery (MCA). Below are controls vs ACTA2 Arg179 patients for mean TI and mean ICA–MCA angles. *p < 0.05. (B) Baseline at 10 days (left) and follow-up at 7.1 years (right) of a patient with ACTA2 p.Arg179Cys pathogenic variant compared to a 60-day-old (left) and a 7.2-year-old (right) control patient. Black and white arrows indicate abnormal straight appearance of basal cerebral arteries that persists in aging in ACTA2 Arg179 patients. Colored bars are proportional to the quantified diameter of the terminal (red bar) to the petrous ICA (green bar) and illustrate age-related progressive stenosis determined by their ratio. Diagram illustrates individual longitudinal data on relative terminal to petrous ICA stenosis. Blue dots represent control patients.

