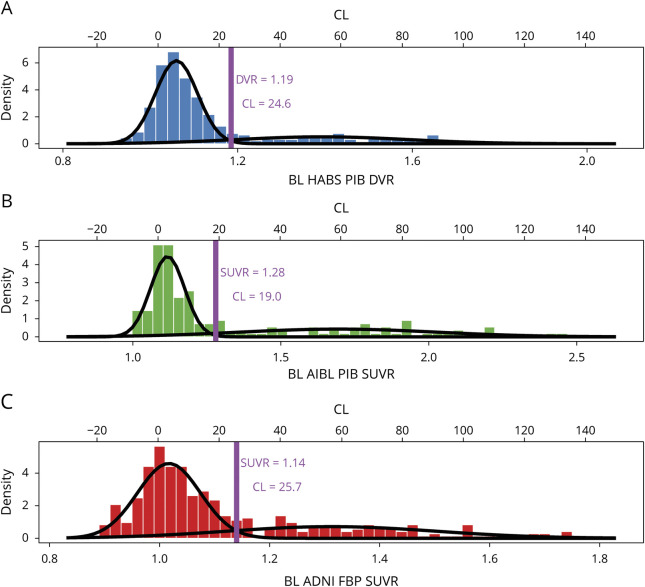
Figure 1. Bimodal Gaussian Distribution of PET Signal in HABS, AIBL, and ADNI.
A–C) Histograms of the baseline (BL) PET data in each sample are plotted and fitted to a bimodal gaussian distribution using gaussian mixture model (GMM). Data are plotted on the tracer for each sample and processing-specific scale on the bottom x-axis and transformed to the Centiloid (CL) scale on the top x-axis. The GMM threshold (purple line) was identified within each sample as the point at which an individual had an equal probability of being in the lower β-amyloid (Aβ)− and higher Aβ+ gaussian. ADNI = Alzheimer's Disease Neuroimaging Initiative; AIBL = Australian Imaging, Biomarker and Lifestyle; DVR = distribution volume ratio; HABS = Harvard Aging Brain Study; PiB = Pittsburgh compound B; SUVR = standardized uptake value ratio.

