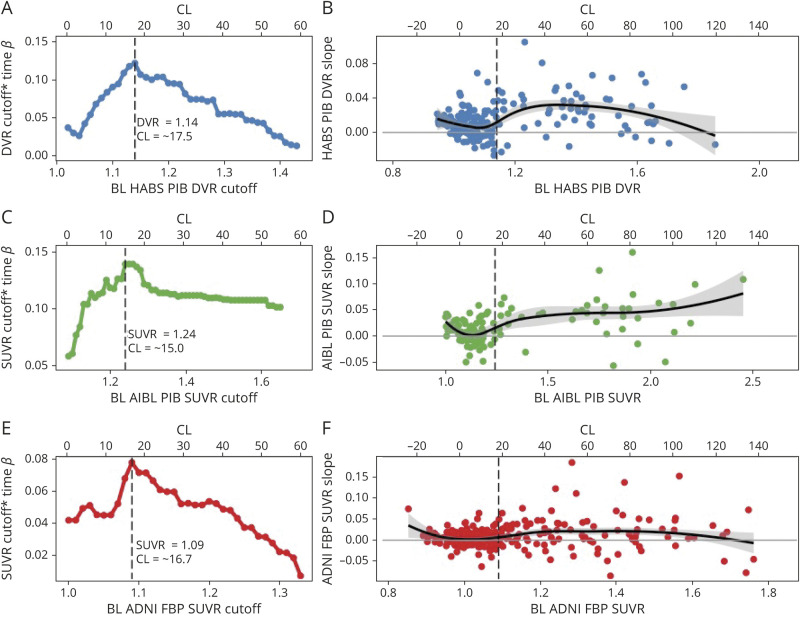
Figure 3. Optimal Cutoffs Within HABS, AIBL, and ADNI Based on Longitudinal Aβ-PET Accumulation.
For each sample, the standardized β for the cutoff × time interaction term from iterative models across a range of possible cutoffs is shown (A, C, E). The optimal cutoff based on Aβ-PET accumulation was set at the cutoff that gave the highest standardized β in each sample. In Harvard Aging Brain Study (HABS) and Australian Imaging, Biomarker and Lifestyle (AIBL), the β-amyloid (Aβ) accumulation–derived optimal cutoff is identical to the cognitively derived optimal cutoff: (A) HABS: Pittsburgh compound B (PiB) distribution volume ratio (DVR) 1.14/Centiloid (CL) 17.5; (C) AIBL: PiB standardized uptake value ratio (SUVR) 1.24/CL 15.0. In Alzheimer's Disease Neuroimaging Initiative (ADNI), the Aβ accumulation–derived optimal cutoff (18F-florbetapir [FBP] SUVR 1.09, CL 16.7) was very slightly lower than the cognitively derived cutoff (FBP SUVR 1.1, CL 18.5). (B, D, F) DVR/SUVR slope over time is plotted as a function of baseline DVR/SUVR within each sample using a loess curve to demonstrate the shift in trajectories of change as function of baseline Aβ-PiB tracer retention. DVR/SUVR slope for each participant was extracted from the slope of the linear regression of DVR/SUVR over time. Data are unadjusted for covariates. In each sample, the slopes below the optimal cutoff consist of a roughly equal proportion of both negative and positive slopes, presumed to reflect random fluctuations in signal noise. Increasing baseline DVR/SUVR is associated with a small negative trend in this range suggestive of regression to the mean. The optimal cutoff appears to mark a shift toward more positive slopes presumed to reflect Aβ accumulation.

