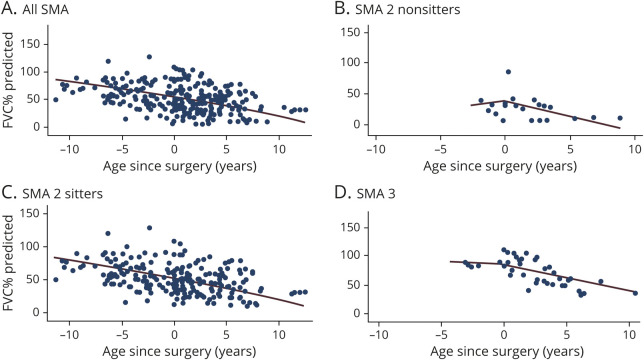
Figure 4. Slope of FVC%P Before and After Spinal Surgery in SMA Types 2 and 3.
(A) Overall population. Forced vital capacity percent predicted (FVC%P) declined yearly by 2.7% before scoliosis surgery and declined by 3.6% afterward (p = 0.22). (B) Spinal muscle atrophy (SMA) type 2 nonsitters. FVC%P increased by 2.4%/y before scoliosis surgery and declined by 5.2% afterward (p = 0.19). (C) SMA 2 sitters. FVC%P declined yearly by 2.8% before scoliosis surgery and declined by 3.4% afterward (p = 0.49). (D) SMA 3 nonambulant. FVC%P declined by 1.3%/y before scoliosis surgery and declined by 4.2% afterward (p = 0.48).

