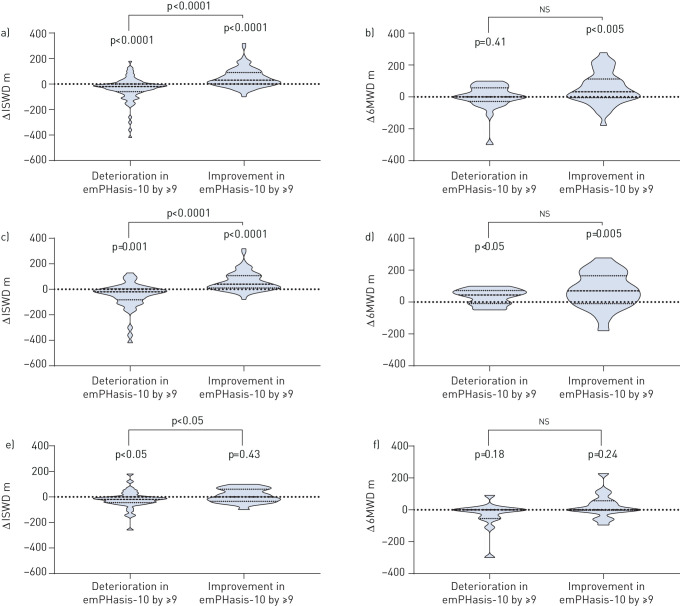
FIGURE 4.
Change, as illustrated by violin plots (where: dashed line=median; dotted lines=25th and 75th percentiles), in incremental shuttle walk distance (ISWD) and 6-min walk distance (6MWD) in patients whose emPHasis-10 score deteriorated by ≥9 or improved by ≥9 between baseline and follow-up ((a and b) all patients, (c and d) incident patients and (e and f) prevalent patients).

