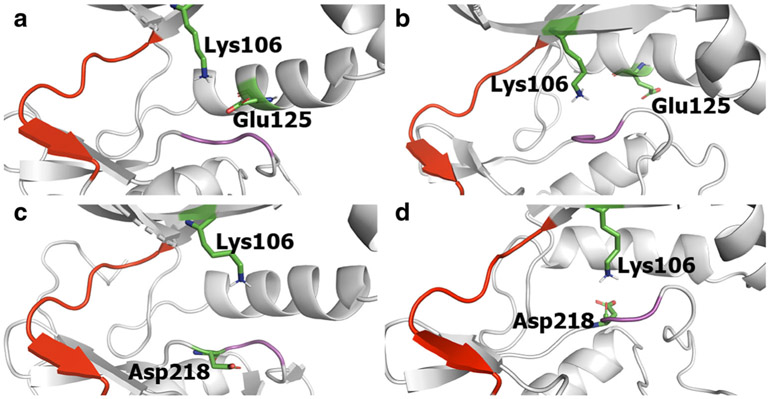
Fig. 3.
Schematic representations depicting the proximity of Lys106 and Glu125 and of Lys106 and Asp218 in DFG “in” and “out” conformations. In the DFG “in” state, Lys106 and Glu125 are close to each other forming a salt bridge (a), which is broken in the DFG “out” state (b). Lys106 and Asp218 are far away in the DFG “in” state (c) and they move closer to each other forming a salt bridge that stabilizes the DFG “out” state (d). The hinge region is depicted in red and the DFG loop in pink

