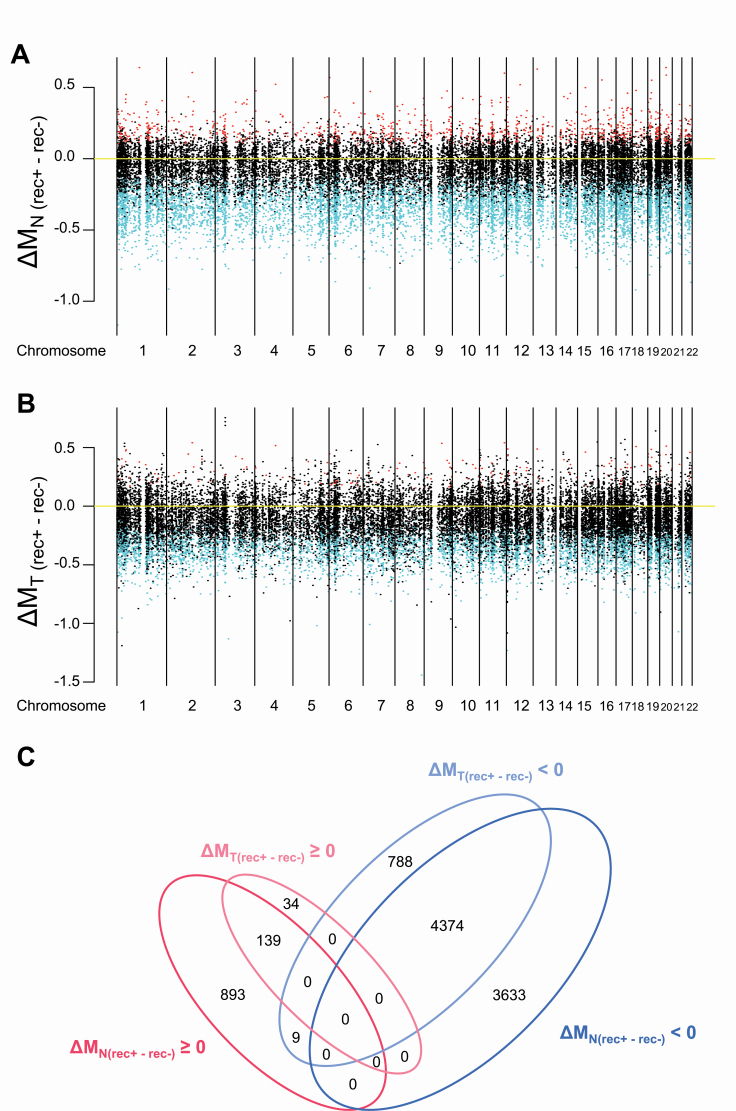
Figure 1.
Correlations between DNA methylation profiles and recurrence in samples of adjacent normal lung tissue (N) (A) and the corresponding tumorous tissue (T) (B) from patients with lung adenocarcinomas. All 26 444 probes are shown along the chromosome. Red and blue indicate probes showing significantly higher and lower DNA methylation levels observed in recurrence-positive (rec+) patients when compared with those in recurrence-negative (rec−) patients, respectively (FDR <0.01). (C) A Venn diagram summarizing the number of probes showing significantly higher and lower DNA methylation levels observed in recurrence-positive (rec+) patients relative to those in recurrence-negative (rec−) patients in panels (A) and (B). ΔM (rec+ − rec−) ≧ 0 means DNA hypermethylation (shown in red) and ΔM (rec+ − rec−) < 0 means DNA hypomethylation (shown in blue) in rec+ patients relative to rec− patients. Most of the DNA methylation alterations in T samples were shared with Ns and the number of probes showing DNA methylation alterations unique to Ts was limited.

