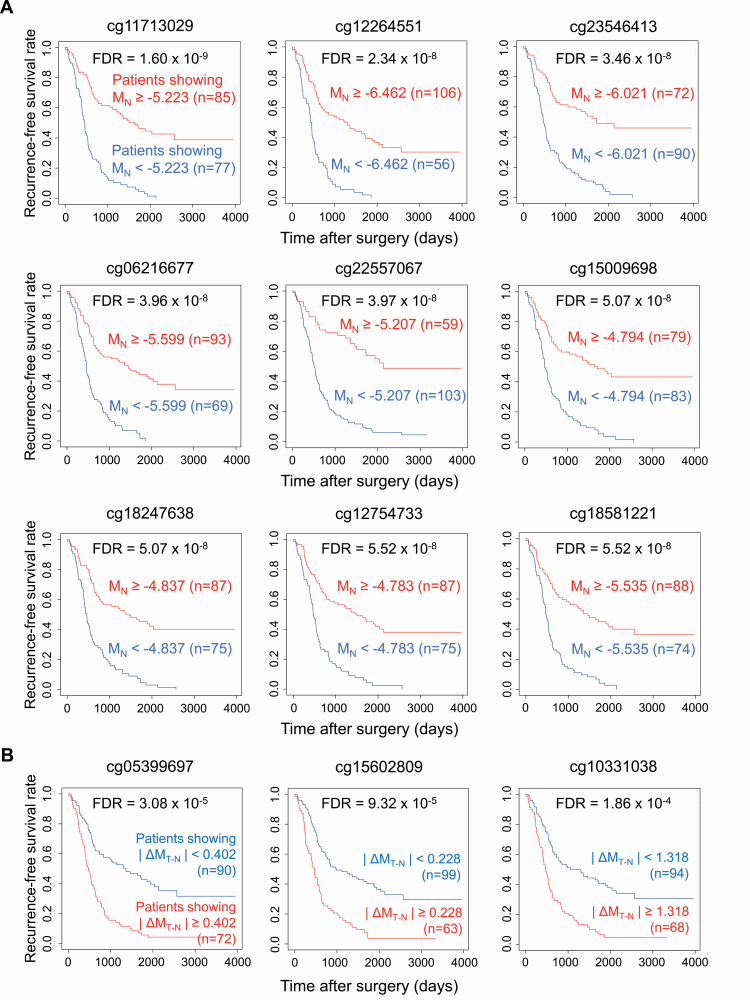
Figure 2.
Prognostic impact of DNA methylation profiles at the precancerous stage (A) and DNA methylation alterations during progression from the precancerous stage to established cancers (B). (A) Representative Kaplan–Meier survival curves of patients showing higher (MN ≥ Youden index based on receiver operating characteristic curves discriminating recurrence-positive patients from recurrence-negative patients) and lower (MN < Youden index) DNA methylation levels in adjacent normal lung tissue (N) samples. (B) Representative Kaplan–Meier survival curves of patients showing larger (|ΔMT–N| ≥ |Youden index|) and smaller (|ΔMT–N| < |Youden index|) differences in DNA methylation levels between N and the corresponding tumorous tissue (T) samples.

