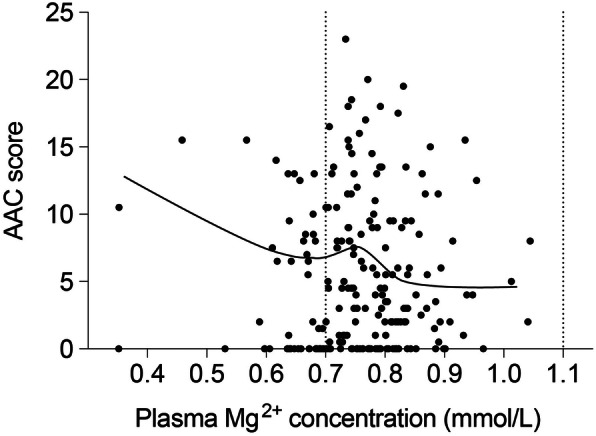
Fig. 2.

Dose-response relation between Mg2+ and abdominal aortic calcification score. The abdominal aortic calcification (AAC)-score for each patient are presented individually and plotted against their plasma Mg2+ concentration at baseline. Dose-response relation between AAC and plasma Mg2+ concentration was investigated by creating a scatter plot and fitting a LOESS smoothed regression line. No transformations were considered due to linearity of the association. Dotted vertical lines indicate the reference values for Mg2+ concentration (0.7–1.1 mmol/L)
