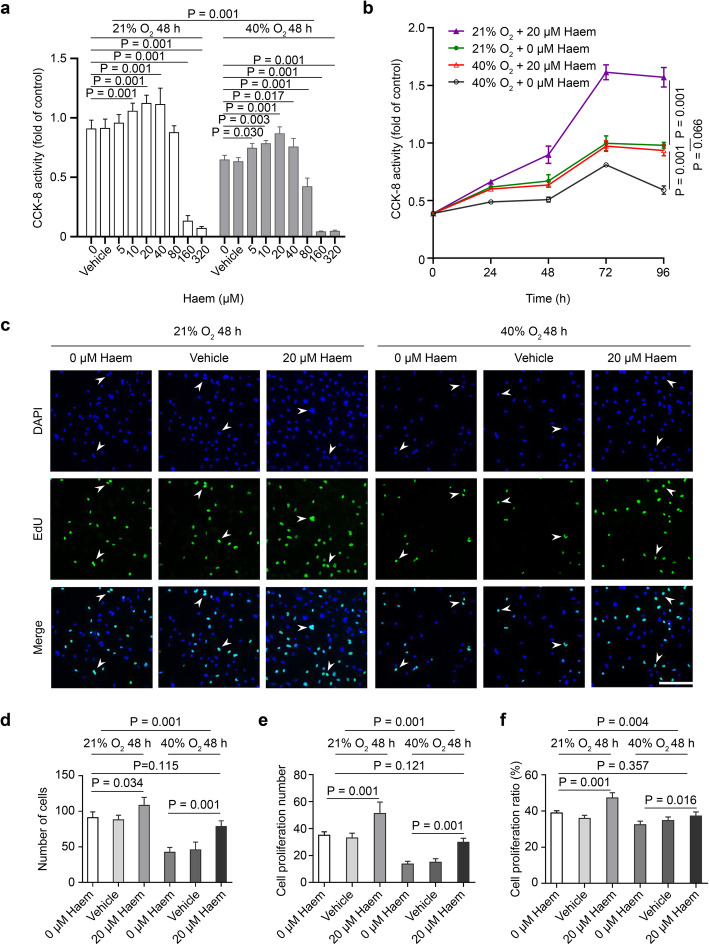
Fig. 2.
Effect of haem on HMEC-1 cell proliferation. a, Diagram showing the effect of different concentrations of haem on HMEC-1 cell proliferation as detected by the CCK-8 method. All data are presented as the means ± SD, and the experiment was repeated three times (n = 4). One-way ANOVA or multivariate ANOVA was performed. b, Diagram showing the effect of different incubation times of 20 μM haem on HMEC-1 cell proliferation as detected by the CCK-8 method. All data are presented as the mean ± SD, and the experiment was repeated three times (n = 4). Multivariate ANOVA with repeated measurements test was performed. c, Images representative of the proliferative activity of HMEC-1 cells as measured by the EdU assay. Under a laser confocal microscope, proliferating cells were stained green (488), and nuclei were stained blue (DAPI). The arrow indicates a representative HMEC-1 cell with proliferative activity (scale bar = 200 μm). d-f, Quantitative analysis of the total number of cells, the number of cells with proliferative activity and the percentage of cells with proliferative activity among HMEC-1 cells subjected to different treatments. All data are presented as the means ± SD, and the experiment was repeated three times (n = 3). One-way ANOVA or multivariate ANOVA was performed

