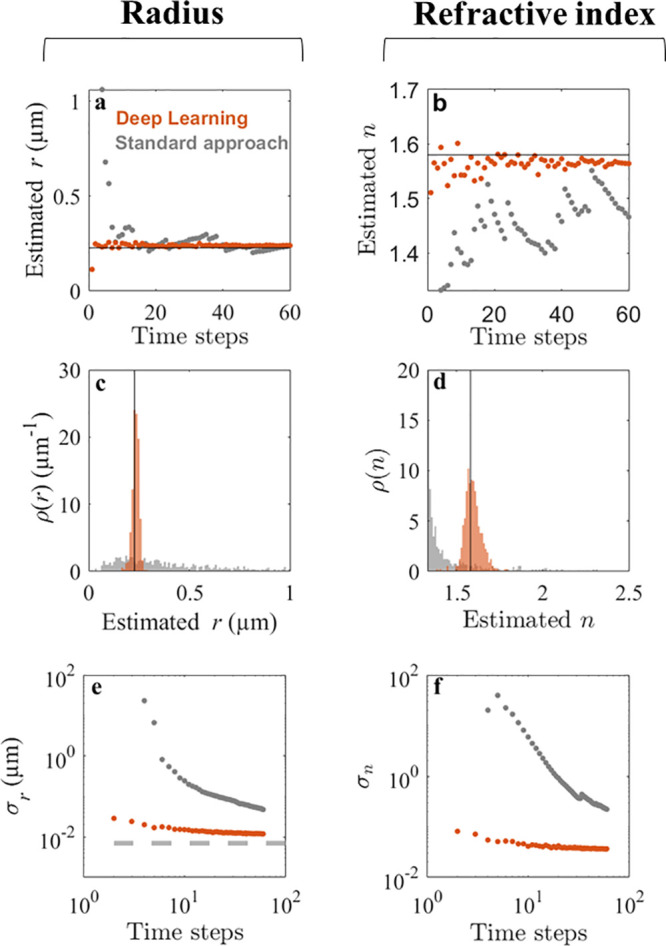
Figure 3.

Deep learning enhances particle characterization on experimental data. (a,b) Estimated radius r and refractive index n of a polystyrene sphere as a function of the number of observations using deep learning (orange symbols) and a standard diffusion-based method (gray symbols). The manufacturer-provided NIST-certified radius is 0.228 ± 0.0068 μm, and the bulk value for the polystyrene refractive index is between 1.55 and 1.59. The accuracy of the deep-learning approach surpasses the diffusion-based approach with all numbers of observations. (c,d) Distribution of r and n on an experimental sample of 256 particles using five observations. While the diffusion-based approach (gray histograms) fails to characterize either property, the deep-learning approach (orange histograms) provides estimates of the radius with ±16 nm standard deviation and of the refractive index with ±0.05 standard deviation. (e,f) Scaling of the standard deviations σr and σn of the measured r and n of the population as a function of the number of observations. The standard deviation of the deep-learning approach (orange symbols) reaches ±11.9 nm in radius and ±0.03 in refractive index units using 60 observations. This performance is much better than that of the standard diffusion-based approach (gray symbols): σr is comparable to the size variation stated by the manufacturer (±6.8 nm NIST-certified standard deviation, gray dashed line in e), and σn is within the range of variability of the polystyrene refractive index.
