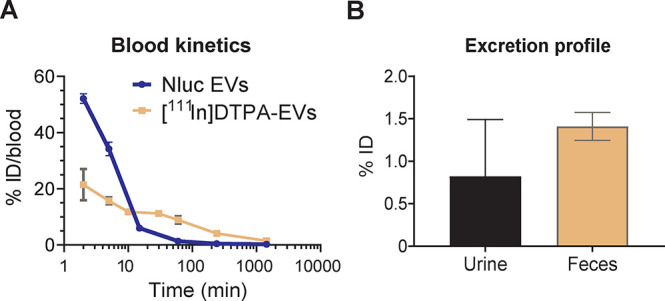
Figure 5.

Blood clearance and excretion profile of NanoLuc and [111In]-DTPA Expi293F EVs. (A) Evaluation of the blood kinetics of EVs as a percentage of injected dose (ID) in blood over time. Blood (50 μL) from NanoLuc (Nluc) EV-treated animals was collected via tail bleeding at 2 min, 5 min, 15 min, 1 h, 4 h, and 24 h and left to clot to obtain the serum for bioluminescence quantification on a FLUOstar Omega plate reader. Blood (5 μL) from [111In]-DTPA EV-treated mice was taken via tail bleeding at 2 min, 5 min, 10 min, 30 min, 1 h, 4 h, and 24 h. Samples were analyzed for [111In]-specific activity using an automated gamma counter. (B) Excretion profile of [111In]-DTPA EVs in urine and feces collected from the animals 24 h postinjection. For all graphs, values are expressed as mean ± standard error of mean, where n = 3 for each group.
