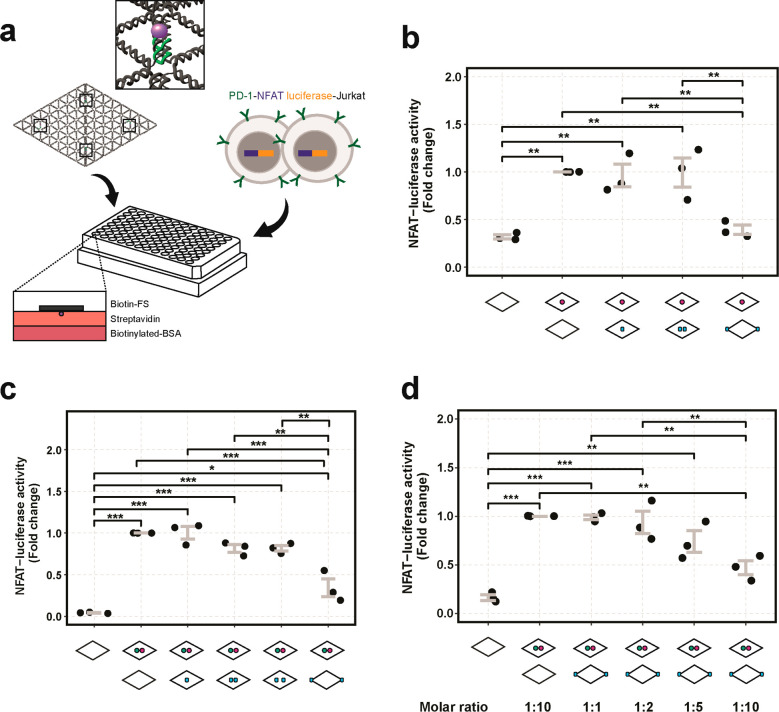
Figure 3.
NFAT-luciferase activity regulated by antibody- and PD-L1-flat sheets. (a) Illustration of the experimental setup of protein–DNA flat sheet stimulation of PD-1-NFAT-luciferase reporter Jurkat cells. Flat sheets folded with biotinylated staples, as indicated by the four black squares and a magnified view of a biotin(purple)–oligo(green), were bound to a precoated streptavidin–biotinylated-BSA surface in a 96-well tissue culture plate before cell seeding. (b) Fold changes of NFAT-luciferase activity of cells after stimulation with FS-empty, FS-α-CD3, and costimulation with FS-α-CD3 and FS-PD-L1, FS-PD-L1-13 or FS-PD-L1-200. (c) Fold changes of NFAT-luciferase activity of cells after stimulation with FS-empty, FS-α-CD3-CD28, and costimulation with FS-α-CD3-CD28 and FS-PD-L1, FS-PD-L1-13, FS-PD-L1-40, or FS-PD-L1-200. (d) Fold changes of NFAT-luciferase activity of cells after stimulation with FS-empty, FS-α-CD3-CD28, and increasing molar ratios of FS-α-CD3-CD28 to FS-PD-L1-200 (1:1 to 1:10). Data is presented from three independent experiments (N = 3) as indicated by the black dots. Every dot represents the average from triplicates consisting of 3000 cells each. Error bars indicate standard error of the mean. P values are indicated as * < 0.05, ** < 0.01, *** < 0.001 as determined by one-way analysis of variance (ANOVA) followed by Tukey’s honest significance (HSD) test.

