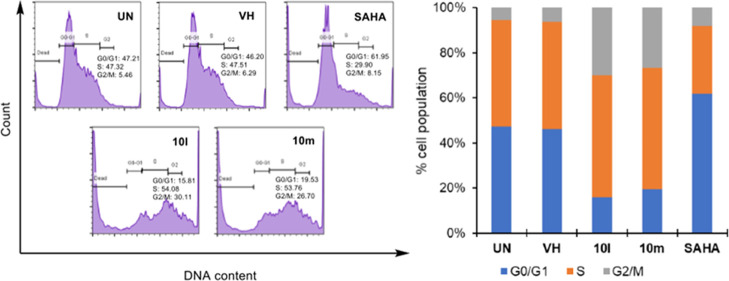
Figure 3.
Cell cycle analysis of representative compounds 10l and 10m. SW620 cells (human colon cancer) (2 × 10⁵ cells) were treated with compounds (10 μM) or SAHA (1 μM) for 24 h. The harvested cells were stained with propidium iodide (PI) in the presence of RNase and then were analyzed for DNA content. UN: untreated, VH: vehicle (dimethyl sulfoxide, DMSO 0.05%). Data were represented as histograms (left) and bar graphs (right).

