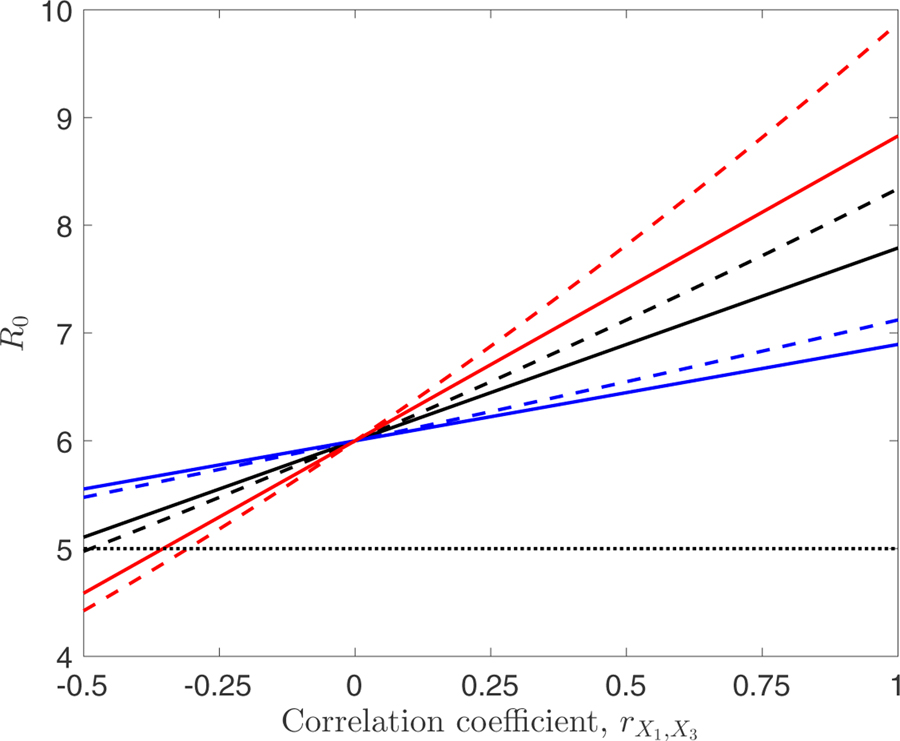
Figure 2:
Comparison of R0 values calculated for multivariate normally-distributed (solid line) and log-normally-distributed (dashed line) heterogeneities for differing values of the correlation coefficient, , between the biting rate, X1, and average duration of human infection, X3. Results are presented for three different levels of the heterogeneity in the average duration of human infection: black lines have Var(X3) = 4 (these are the lines that appear in Figure (1); blue lines have Var(X3) = 1, while red lines have Var(X3) = 10. As in Figure (1), X1 and X3 are taken to have means equal to 1 and 5, respectively, and Var(X1) = 0.2. The value of the susceptibility parameter was fixed at 1 for the entire population. The horizontal dashed line denotes the value of R0 if there was no heterogeneity, i.e. obtained using the average value, .

