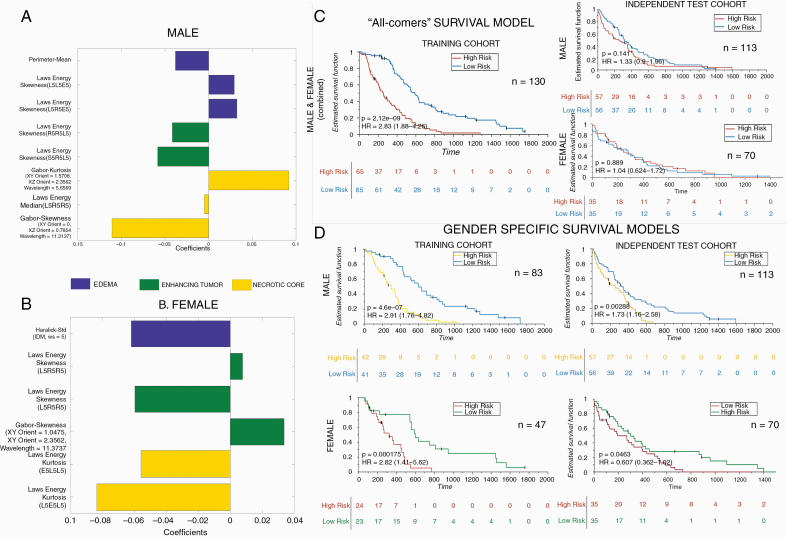
Fig. 3.
Sex-specific radiomic models and survival analysis. Forest plot of beta coefficients of the 8 and 6 radiomic features selected in the radiomic risk score for male (A) and female (B) respectively from Gd-T1w MRI. (C) Kaplan–Meier curves for male and female combined “all-comers” patients stratified into low-risk and high-risk groups according to the radiomic risk score in the training cohort and independent validation set respectively. (D) Kaplan–Meier curves for male and female patients stratified into low-risk and high-risk groups according to the radiomic risk score (male cutoff = 0.0322, female cutoff = 0.0221) in the sex-specific training cohort and independent validation set respectively. X-axis represents overall survival days, and Y-axis represents the estimated survival function.

