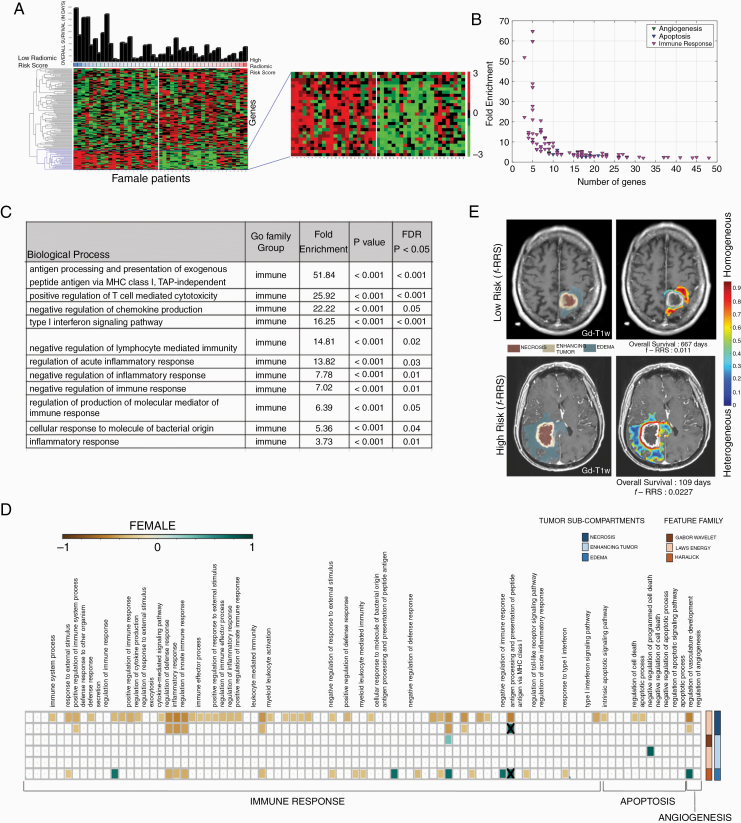
Fig. 5.
Radiogenomic analysis of female GBM patients. (A) Hierarchical clustering of the differentially expressing genes (DEG, n = 130, P < 0.05, false discovery rate = 5%) for sex-specific radiomic risk score within the training cohort. (B) 2-D scatter plot to illustrates the number of genes involved in each biological process. (C) This table lists key GO biological processes in female GBM patients. Their respective enrichment score, P-values, and FDR corrected P-values are shown. (D) Spearman’s rank correlation coefficient (ρ) matrix of the single-sample Gene set enrichment analysis (ssGSEA) scores and radiomic features extracted from the GBM tumor subcompartments, where statistically significant associations (P < 0.05) were identified on the training cohort (as shown with colored boxed) and verified on the CPTAC test cohort (as shown with “X” symbol). (E) Radiomic heatmap of Haralick feature (IDM) in the peritumoral edema region of high-risk and low-risk female patients has been illustrated.

