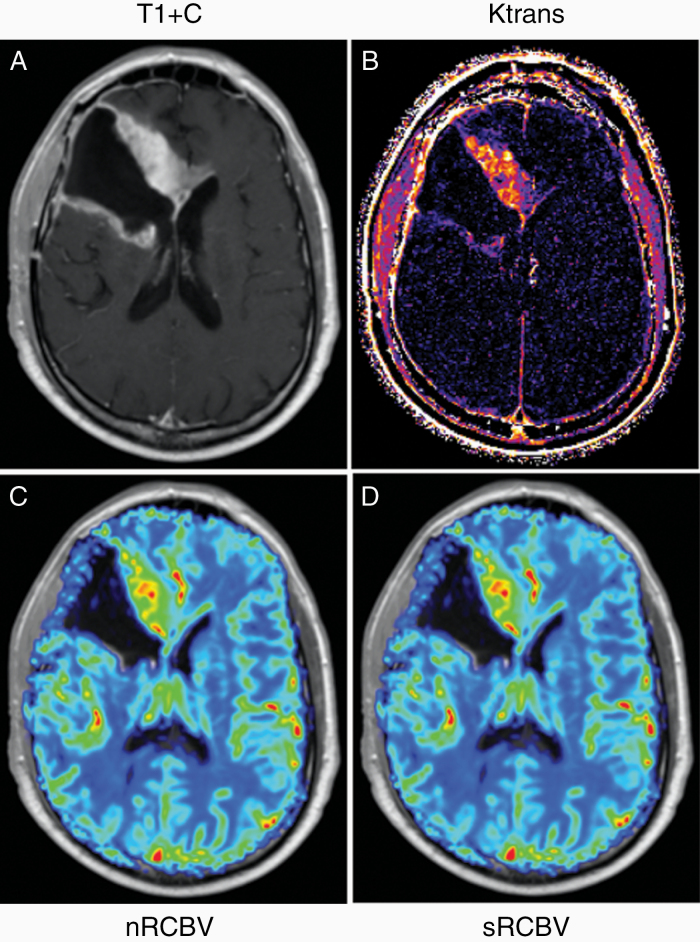
Fig. 1.
Example images and parameter maps for case 193 prior to bevacizumab/placebo treatment. Shown are the (A) postcontrast T1-weighted images along with the corresponding (B) Ktrans map from the DCE-MRI data and (C) normalized rCBV (nRCBV) and (D) standardized rCBV (sRCBV) maps from DSC-MRI data.

