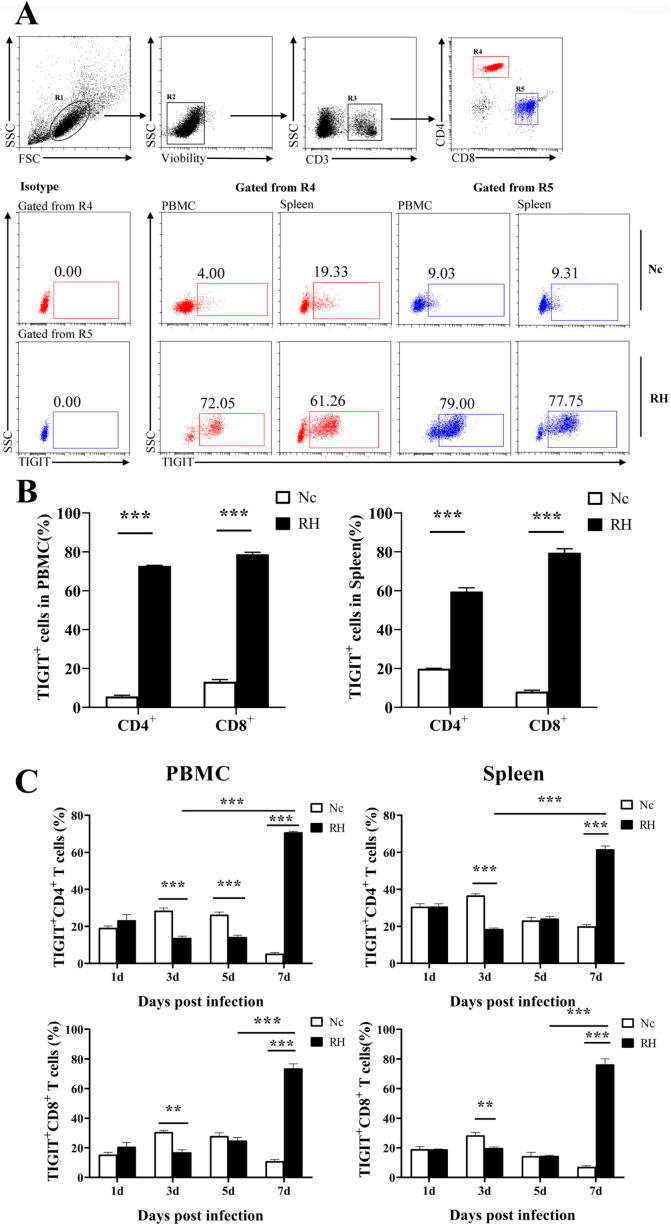
Fig. 1.
Changes in TIGIT expression on T cells in different tissues after T. gondii infection. (A) Proportions of TIGIT+ cells among CD4+ and CD8+ T cells in T. gondii-infected (RH) and normal mice (Nc) at 7 days after infection. (B) Results of statistical analysis of the percentage of TIGIT+ cells among CD4+T and CD8+T cells in RH and Nc mice at 7 days after infection. (C) Dynamic changes in the percentages of TIGIT+ in T cells at different time points. The results are representative of three independent experiments with five mice in each group per experiment, with data denoting means ± SDs.

